
2.7 Digitize and Edit Features
One of the most common ways new features are created is by simply adding them to a map based on known coordinates or underlying reference layers. This process is called digitizing. Nowadays, digitizing is most often performed by tracing a map or image in GIS software with the cursor on screen, which is known as heads-up digitizing. Georeferencing and heads-up digitizing sometimes go together, such as when you want to record features shown on an old map or historic aerial photo. Alternatively, tablet digitizing involves using a special input device called a puck to trace over a hard-copy map taped to a large flat surface gridded with circuits, called a tablet. Since tablet digitizing requires special hardware and heads-up digitizing does not, this section will only cover the latter.
Section Outcomes
In this section, you will:
- Create a new feature class
- Add features by tracing the map
- Add features by known coordinates
- Edit feature geometries
- Edit feature attributes
 Create a new feature class
The first step to digitizing is creating a file container and layer to digitize features into. The new feature class must be assigned the correct geometry (point, line, or polygon) and the attributes necessary to represent the features being digitized. It should also be assigned the same coordinate system as the map frame, as that will allow for the most accurate positioning of feature vertices. The feature class can be transformed into other coordinate systems as needed after features are digitized.
1. Open the ArcGIS Pro project you used for Section 2.6, or create a new map project and set the basemap to satellite imagery.
2. Choose a set of geographic features shown in your georeferenced image from Section 2.6 or the imagery basemap to digitize that are all the same general type of feature (e.g., political boundaries, lakes, buildings, etc.).
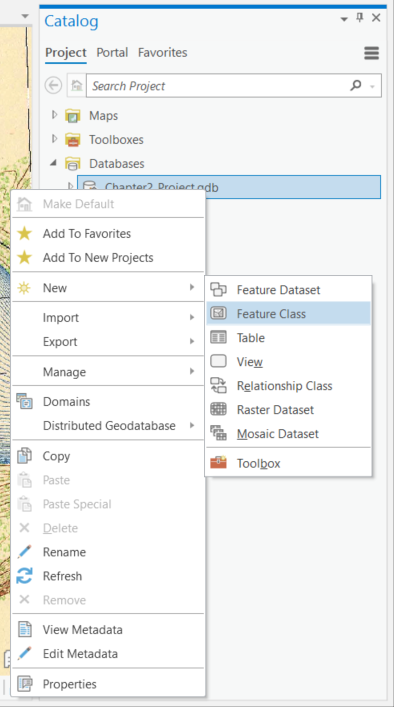
3. In the Catalog pane, expand the Databases item, then right-click on the project database and select “New→Feature Class”.
4. In the Create Feature Class pane, give your new feature class an appropriate name (with no spaces or special characters), choose the correct feature geometry (“Feature Class Type”), and uncheck “Z Values” under “Geometric Properties”, then click the Next button.
5. In the Fields table, add new fields for each attribute that the feature class should have, specifying the correct data type for each new field (see Section 2.4 for an explanation of the different data types). When finished adding fields, click the Next button.
6. Under Spatial Reference, choose the coordinate reference system used by the map frame, then click the Next button.
7. Click the Next button twice to move through Tolerance and Resolution, accepting the defaults for each. On the last pane, Storage Configuration, click the Finish button.
![]() Teachback 22 — Perception and Interpretation
Teachback 22 — Perception and Interpretation
Add features by tracing the map
The simplest way to add features to your new feature class is to trace objects that you can see on a georeferenced raster map or imagery. If you plan to create multiple features that share endpoints or boundaries, snapping can help avoid geometry errors like undershoot, overshoot, and slivers caused by overlapping polygons.
8. Zoom the map in closely to the location where you will begin drawing your first feature.
9. In the Edit ribbon tab, click the Create button.
10. In the Create Features pane, under “Templates”, click the name of the feature class you created for digitizing.
11. Begin drawing the first feature by clicking on it on the map. If the feature is a point, it will be placed immediately, so you can skip Steps 12 and 13.
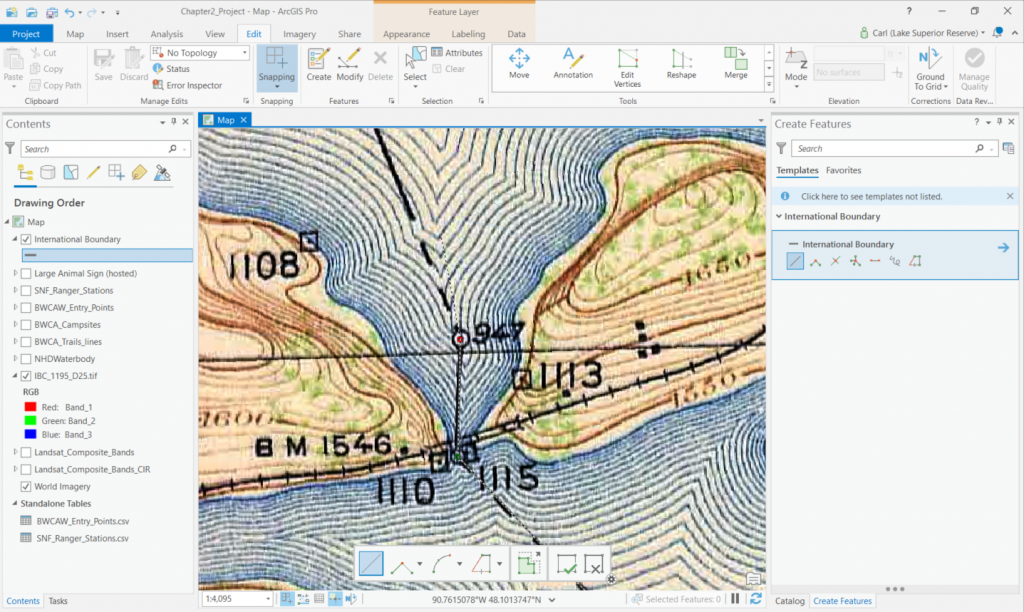
12. If drawing a line or polygon, click other places along the feature boundary to place vertices (Figure 2.51).
13. If you are drawing a polygon and it becomes difficult to see the reference layers under the polygon fill, increase the polygon layer’s transparency using the Transparency input in the Appearance ribbon tab for the layer. (Remember that the layer must be selected in the Contents pane to access its Appearance tab).
14. When finished, double-click on the map or click the Finish button (the button with the green checkmark) on the toolbar at the bottom of the map to place the feature.
15. If you are satisfied with the feature, in the Edit ribbon, click the Save button (which looks like a large purple floppy disk with a pencil), then hit “Yes” in the pop-up window to write the new feature to the feature class. If you want to remove the feature and redraw it, click the Delete button (which looks like a red X) or hit the Delete key on your keyboard.
Why are there two Save buttons?
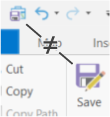
Step 14 is important! Your new features and other edits to a dataset do not save automatically, nor do they save when you save the project. This is because an ArcGIS Pro project simply provides a container with links to the various layers shown on the map; it does not embed the data for the layers (this is also discussed in Section 1.3).
Think of an ArcGIS Pro project as like a picture frame in an art gallery, and the data as the artwork within the frame. Saving the project saves changes to the frame, but not changes to the artwork. Thus, if you digitize or edit features and just click the Save Project button, then close the project, the next time you reopen the project, your features or edits will have disappeared! You must also click the large Save button in the Edit ribbon tab to save changes to the data shown on the map.
16. In the Edit ribbon tab, click the small Clear button to deselect the new feature.
17. In the Edit ribbon tab, make sure the Snapping button is active. Click the down arrow under the button and hover your mouse over each snapping option to read its tooltip. (Note that there is also a small Snapping button in the bottom-left corner of the map with the same options).
![]() Teachback 23 — Perception and Interpretation
Teachback 23 — Perception and Interpretation
- If you digitize two adjacent polygons, which snapping options should be active? Why?
- What is the snapping tolerance? How does it affect digitizing?
- Should snapping always be on? When might it be useful to turn snapping off?
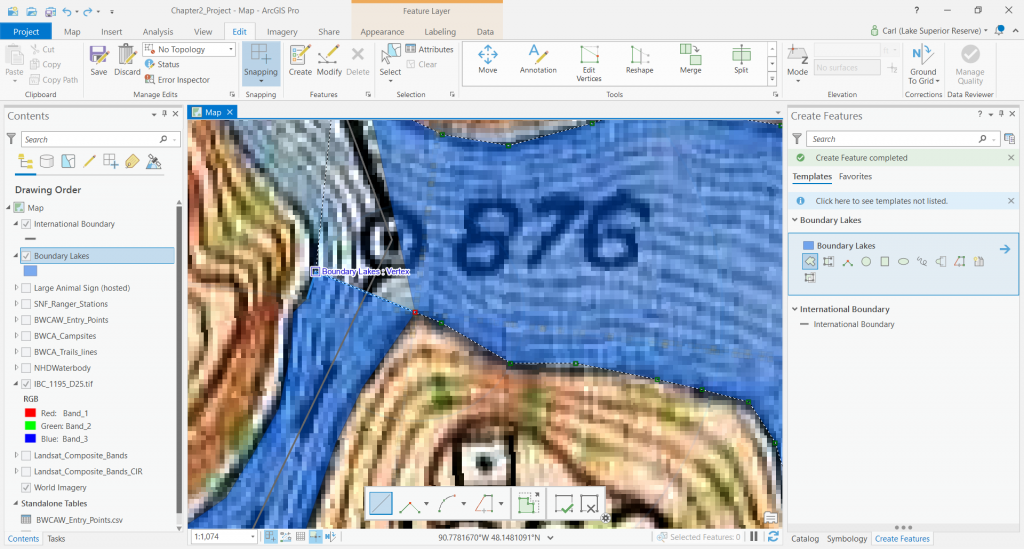
18. Using one of the tools in the Create Features pane, draw another feature that borders or intersects the first feature you drew. Use snapping to ensure the features intersect at the correct location and have no gaps between their borders if they are adjacent polygons (Figure 2.53).
19. Save your edits and continue adding more features.
Add features by known coordinates
Sometimes you may know the exact coordinates of a point feature or vertex you want to add to a vector dataset. If you have several sets of known coordinates for point features, you can add these as a spreadsheet and create a map layer by following the steps in Section 2.2. But for just one or two points with known coordinates, or vertices of a line or polygon with known coordinates, it is easy to add the point or vertex by right-clicking on the map while digitizing.
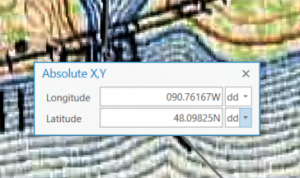
20. Using one of the tools in the Create Features pane, right-click on the map, then click “Absolute X,Y, Z…”
21. Enter the longitude and latitude coordinates in decimal degrees, or change the unit dropdowns if your coordinates use different units, then hit the Enter key on your keyboard (Figure 2.54).
Edit Feature Geometries
ArcGIS Pro’s editing tools give you the power to edit the geometry of existing features. This comes in handy if a feature’s shape or location has changed, or if you want to fix geometry errors, improve a feature’s accuracy, or cut inner rings out of a polygon feature. The tools for modifying existing features can be accessed through the Edit ribbon tab’s Tools gallery or the Modify Features pane, opened by the Modify button in the Edit ribbon tab.
22. In the Edit ribbon tab, click the Modify button to open the Modify Features pane.
23. In the Edit ribbon tab, click the Select button.
24. On the map, click on a feature you would like to edit.
25. In the Modify Features pane, under “Reshape”, click the Edit Vertices button (or click the Edit Vertices button in the Tools gallery of the Edit ribbon tab).
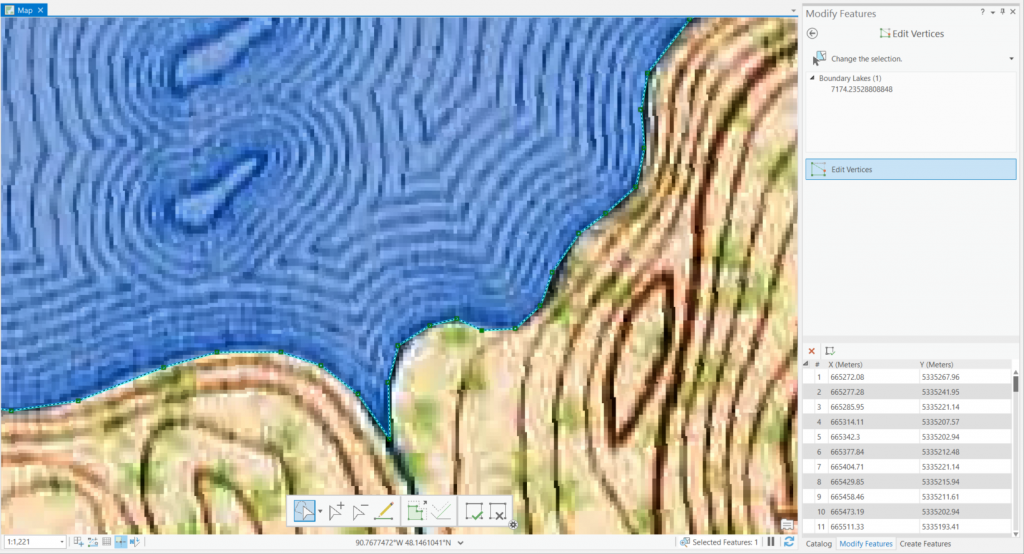
26. Click and drag vertices to adjust their positions.
27. In the toolbar at the bottom of the map, use the Add button to add new vertices as needed, and use the Delete button to delete vertices.
28. To add an inner ring to the polygon (i.e., cut a hole in the polygon) or add a separate part to a multipolygon, click the Continue Feature button (which looks like a pencil over a line), then click the map to add vertices along the feature boundary.
29. When satisfied with your edits, click the Finish button on the toolbar at the bottom of the map.
30. Save your edits using the Save button in the Edit ribbon tab.
Edit Feature Attributes
So far, you have just created and edited feature geometries. Each new feature you create is assigned a row in the attribute table for the dataset. Its values for each attribute are null or assigned a default value until you edit them in the table. Here we will just look at editing the values in existing table fields; adding and removing fields from the table is covered in Section 3.2.
31. In the Contents pane, right-click the layer name of the feature layer, then click “Attribute Table” to open the attribute table. Alternatively, select the layer in the Contents pane, then open the Data ribbon tab and click the Attribute Table button.
32. Determine which feature corresponds to each row by clicking on the gray box to the left of each row to select its feature and highlight it in teal on the map.
33. Click the first <Null> table cell that should be filled in with a value, and type the value of the attribute shown in the field (column) header for the row’s feature (Figure 2.56).
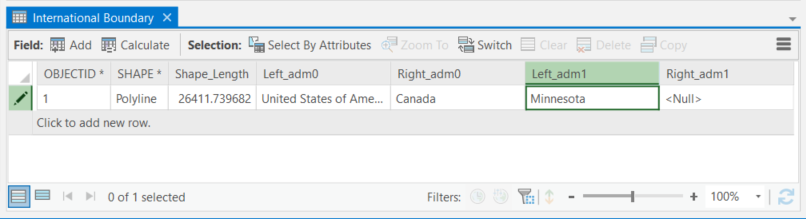
34. Continue editing attribute values for each feature you added to the dataset.
35. In the Edit ribbon tab, click the Save button to save your edited attribute values.
36. Save the project.
![]() Teachback 24 — Evaluation
Teachback 24 — Evaluation
Further Resources
Teachback 25 — Chapter Reflection
- Write a reflection essay describing what you learned from completing the work in this chapter. Explain:
- What did you learn about geographic data by creating and manipulating it?
- What types, models, and formats of data can you create using GIS? How is each created?
- What other types of geographic data, created by other means, can be used in GIS?
- What was most difficult in this chapter?
- What key “aha!” moments did you experience?
- What were the biggest takeaways you will remember when working on future GIS projects?
- If possible, share your essay with a classmate or colleague who also completed the chapter and discuss your experiences with the chapter exercises.
The process of creating vector feature data by tracing over raster imagery or maps
A shared property of features in a geospatial dataset with different values for different features or pixels, represented as a column in the dataset's attribute table
A system for locating features on the Earth, consisting of a datum, projection (if a projected coordinate system), and coordinate grid
The type of values for an attribute, such as boolean (yes/no), text, integer (short or long), float (single- or double-precision), or date/time
a setting for digitizing that moves vertices placed within a certain pixel distance of existing points or lines onto those points or lines.
