
2.2 Create Point Features from a Table
Geographic information can come in many forms. Point features need not be recorded as GPS waypoints; they can also be created from a simple spreadsheet table with separate columns for latitude and longitude coordinates. Each table row must contain data for one geographic feature, including that feature’s coordinates. Other columns in the dataset may represent other attributes, such as the feature name, description, numerical values, dates, and other observations about the feature.
This kind of table can be easily created in any spreadsheet program, such as Microsoft Excel, Google Sheets, or LibreOffice Calc. ArcGIS Pro recognizes tables in Excel (.xlsx) and comma-separated values (.csv) format as data that can be added to a project. If the table contains columns for geographic coordinates, it can be converted to a map layer using one simple operation.
Section Outcomes
In this section, you will:
- Add a spreadsheet table to an ArcGIS Pro project, and
- Convert geographic spreadsheet data to a point feature class.
 Add a spreadsheet table to an ArcGIS Pro project
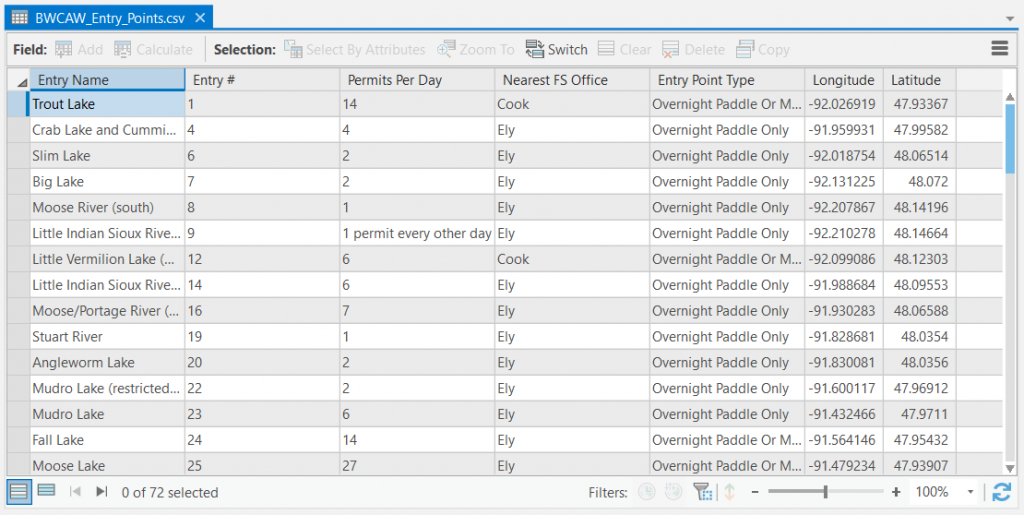
For this exercise, you will need a spreadsheet table, saved in CSV (.csv) or Microsoft Excel (.xlsx) format, in your GIS data folder. The table must contain data related to geographic point features, with one row per feature, and columns titled “latitude” and “longitude” that contain the geographic coordinates of each feature.
1. In ArcGIS Pro, in the Catalog pane, expand the folders containing your spreadsheet table.
2. If your table is in Excel format, expand the Excel workbook container to reveal the table (Figure 2.7).
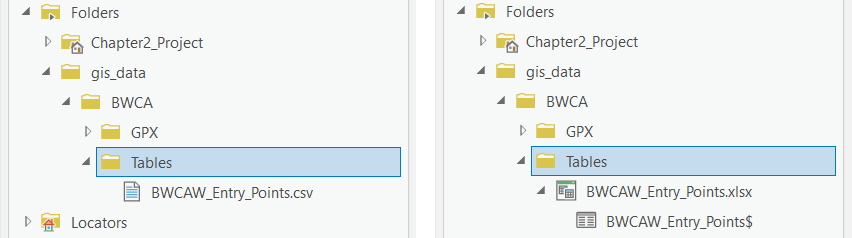
3. Click and drag the table onto the map to add it to the Contents pane; or right-click the table, then click “Add To Current Map”.
4. In the Contents Pane, right-click the table, then click “Open”.
Convert the geographic spreadsheet data to a point feature layer
In ArcGIS Pro, the “Display XY Data” tool is used to convert simple spreadsheet data containing latitude and longitude coordinates into a point feature layer on the map.
5. In the Center View, click the small “X” button in the title tab at the top of the table to close the table.
6. In the Contents pane, right-click the table, then click “Display XY Data”.
7. In the Display XY Data window, under “Output Feature Class”, browse to your project geodatabase, and enter a suitable name for the feature class (remember, no spaces!).
8. Confirm that the “X Field” contains the name of the table’s longitude column, and the “Y Field” contains the name of the table’s latitude column.
9. Leave the “Z Field” and “Coordinate System” inputs as they are, and click “OK” (Figure 2.9).

![]() Teachback 4 – Evaluation
Teachback 4 – Evaluation
With the Explore tool active, click on one of the new point markers on the map. Answer the following:
- What attribute information does the feature include?
- Where did this information come from?
- Two of the attributes are the feature’s latitude and longitude. If you changed the values of these attributes, would the position of the feature change on the map? Explain your answer.
Further Resources
A shared property of features in a geospatial dataset with different values for different features or pixels, represented as a column in the dataset's attribute table
A simple spreadsheet format that can be viewed in a text editor, in which table cells are separated by commas
A format for geographic coordinates that expresses latitude and longitude in fractions of a degree, with positive values for north latitudes and east longitudes, and negative values for south latitudes and west longitudes
