
1.4 Change the Map Projection
The world is round, but maps are flat. This causes some problems. Have you ever tried to peel an orange in one piece and then flatten out the peel? You can’t do it without the peel bending and ripping in several places. The same holds true for the Earth’s geography—it gets distorted whenever you try to flatten it out. This video gives a great explanation of why and how this happens.
Cartographers (people who study map making) have come up with many different ways to distort the Earth’s shape to achieve different goals. Each uses a set of mathematical equations called a map projection to transform three-dimensional geographic (latitude, longitude) coordinates into two-dimensional planar (x, y) coordinates. Some projections preserve the angles of features but greatly distort areas and distances. Others preserve areas but distort angles and distances, and still others preserve distances along at least one axis but distort angles and areas. They have different shapes, too, which are named based on the imaginary shape surrounding the globe onto which its geography is projected: cylindrical (which look rectangular on a map), conic (which look arched), and azimuthal or planar (which look circular). Map projections are further explained in Section 2.2 of the Campbell and Shin text.
So far, you have let ArcGIS Pro determine your map’s projection for you. Before you added any data, the basemap used the Web Mercator projection, the projection used by most web maps. Once data is added, ArcGIS Pro transforms the map into the same projection that is assigned to the first dataset added to it—so if your point data came with a projection assigned to it, that is likely the projection of your map (dataset projections will be covered in Section 3.5). However, many datasets do not have an assigned projection, and simply use geographic coordinates. If the first dataset added to the map does not have an assigned projection, ArcGIS Pro assigns the map an equirectangular projection (also called the plate carrée or geographic projection). This projection simply translates longitude into the planar x coordinate and latitude into the planar y coordinate. The result is a rectangular Earth that is incredibly distorted, especially near the poles—not a suitable look for most maps.
Section Outcomes
In this section, you will:
- choose a suitable map projection, and
- change the map projection.
 Choose a suitable map projection
The projection you use for your map should depend on your map’s purpose. There are scores of projections out there, but just a few that are very popular and used in most maps. Here are a few guideposts to use in selecting your projection based on mapping conventions:
- If you are making a map of the whole world, choose a projection that fairly represents the geography of different hemispheres at a global scale, such as Robinson, Winkel tripel, or Equal Earth.
- If you are making a map of a wide mid-latitude area, such as the United States, Russia, or Australia, or a wide, short state such as Tennessee, use a conic projection, such as Albers equal-area or Lambert conformal.
- If you are making a map of just the tropics, use a cylindrical projection, such as Mercator or Miller.
- If you are making a map of the whole world and want to emphasize the tropics, use an equal-area cylindrical projection such as Gall-Peters or Hobo-Dyer.
- If you are making a map centered on the North or South Pole, use an azimuthal projection, such as azimuthal equidistant or Gnomonic.
- If you want your map to look like a globe, use an orthographic projection.
- If you are making a map of a tall, thin mid-latitude area, such as a state like California or Minnesota, use the appropriate Universal Transverse Mercator zone.
- If you are making a large-scale map of a small area and wish to keep straight features (like roads and political boundaries) straight and at the correct compass angle, use a Mercator projection.
1. In a browser, go to Wikipedia’s list of map projections.
2. Using the projection descriptions in the Wikipedia list and the guidance above, choose a projection that is appropriate for your map given its geography and goal (from Teachback 1).
![]() Teachback 14 – Evaluation
Teachback 14 – Evaluation
Which map projection did you choose for your map? Why?
Change the map projection
Once you have chosen a map projection, you can assign it to your map in ArcGIS Pro through the map properties. One thing to watch out for is that some projections have many variations depending on the underlying datum (e.g., WGS 1984, NAD 1983, etc.), distance units (e.g., meters or feet), and geographic area of focus. Choose a version that best fits your map’s geography. For now, don’t worry about which datum or units the projection uses.
3. Return to ArcGIS Pro.
4. In the Contents pane, right-click the map, then click “Properties”.
5. On the left side of the Map Properties window, click “Coordinate Systems”.
6. In the search bar on the right side of the Map Properties window, enter the name of your chosen projection.
7. In the gray box within the Map Properties window, click on the small arrow next to “Projected coordinate system” to expand that folder, then expand its subfolders until you reach a list of projections for the geographic area of your map (Figure 1.18).
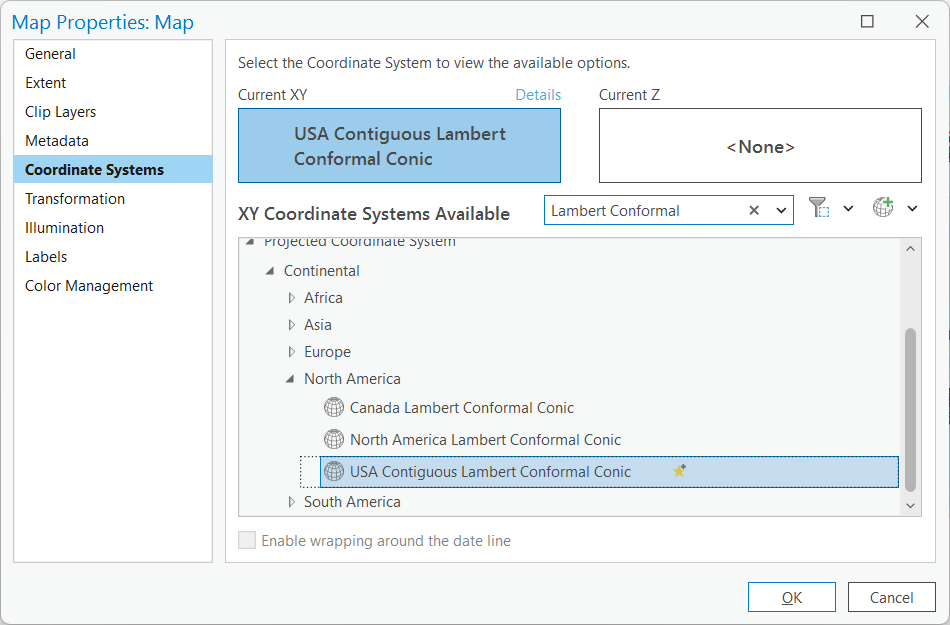
8. Click on the desired map projection, then click “OK” to assign it to the map.
![]() Teachback 15 – Perception, Interpretation, and Evaluation
Teachback 15 – Perception, Interpretation, and Evaluation
- How did assigning the projection you chose change the appearance of your map?
- Now that you can see how your map looks with it, is the projection you chose the right one? Why or why not? (If it’s not, return to Wikipedia and find another projection that might be better, then assign that projection to your map, until you are satisfied).
Further Resources
Additional information about assigning a projection to a map in ArcGIS Pro is available on the ArcGIS Pro Help website “Specify a coordinate system” page. A list of map projections that are supported in ArcGIS Pro is available on the Map Projections in ArcGIS Story Map.
A mathematical transformation from a three-dimensional geographic surface to a two-dimensional planar surface.
Commonly used map design strategies that aid comprehension by being familiar to map users
A geographic coordinate system consisting of an ellipsoid model and a point of origin for latitude and longitude coordinates
