
1.5 Symbolize Map Layers
Now that you have added the layers you will need to your map and have chosen a suitable map projection, you will need to adjust how the map symbols for each layer look to help them convey meaning to the users of your map. When you import a vector dataset into ArcGIS Pro, the program randomly assigns simple symbols of the correct dimensionality to the layer. You should change the symbols for each layer to follow mapping conventions, or ways that map users expect the see the information presented. This will help ease the map’s interpretation and better convey the understanding you want your map to deliver.
Mapping conventions are ideas you already have in your head about how a map should look from seeing other maps produced by the culture that you are part of. Examples of symbol conventions include using blue as the color of water, green for parks, black or gray thin lines for minor roads, thicker red or green lines for major roads, circles or squares for cities, and star symbols for capitals. What other symbol conventions can you think of? It may help to look at a few professional maps for ideas before you begin this section.
For further discussion of mapping conventions (though not directly related to symbols), see Section 2.2 in the Campbell and Shin text.
Section Outcomes
In this section, you will:
- adjust the order and visibility of map layers,
- symbolize the map’s point layer,
- symbolize the map’s line layer, and
- symbolize the map’s polygon layer.
 Adjust the order and visibility of map layers.
When you add data to an ArcGIS Pro project, the layers don’t always automatically appear in the right order. You might run into a situation where, say, your polygons cover up your points, or one layer otherwise interferes with another. Sometimes these problems can be fixed simply by reordering layers in the Contents pane. Other times, it may be helpful to adjust the transparency of a layer, to allow you to see through its symbols to what is underneath. Finally, ArcGIS Pro allows you to set a minimum and maximum zoom level for layers, so they will only display at certain scales.
1. In the Contents pane, click on the layer name of the polygon layer, then hold down the left mouse button and drag it up to the top of the Drawing Order (Figure 1.19).
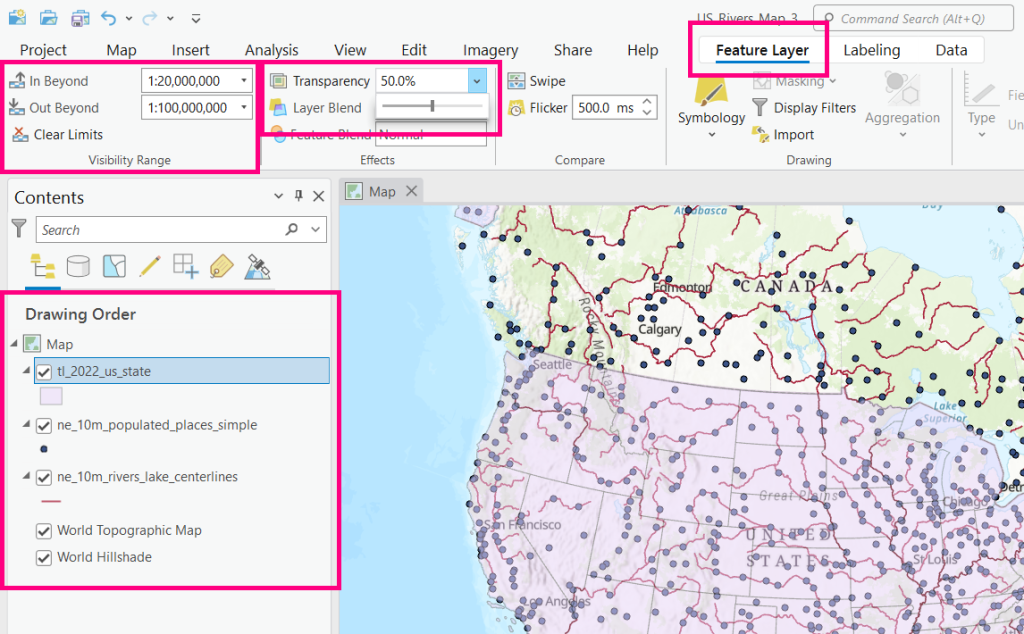
2. With the layer name of the polygon layer still highlighted in the Contents pane, click the Feature Layer ribbon tab. (Note that this tab, along with the Labeling and Data tabs, only appear when a feature layer is highlighted in the Contents pane, and the settings within them apply only to the highlighted feature layer).
3. In the Effects group of the Feature Layer tab, click and drag the transparency slider, or adjust the percentage in the white box by typing a number between 1 and 100 or using the up arrow in the box (Figure 1.19).
4. In the Visibility Range group of the Feature Layer tab (Figure 1.19), set the “In Beyond” dropdown to a scale with a denominator that is less than the current map scale (the representative fraction at the bottom-left corner of the map). Set the “Out Beyond” dropdown to a scale with a denominator greater than the current map scale.
5. Zoom the map in until the map scale is larger than the “In Beyond” scale (i.e., until the map scale has a smaller denominator than the “In Beyond” scale).
6. Zoom the map back out until the map scale is smaller than the “Out Beyond” scale.
7. In the Visibility Range group of the Feature Layer tab, click the “Clear Limits” button.
8. Reset the polygon layer transparency to zero.
9. In the Contents pane, return the polygon layer to the lowest data layer in the Drawing Order, just above the basemap(s).
![]() Teachback 16 – Perception and Interpretation
Teachback 16 – Perception and Interpretation
- What happened to the polygon layer when you zoomed the map to a larger scale than the “In Beyond” scale or a smaller scale than the “Out Beyond” scale in the Visibility Range?
- What happens if you reverse the Visibility Range dropdowns (give “In Beyond” a smaller scale than “Out Beyond”)? Why?
Symbolize the map’s point layer.
Teachback 17
Based on other maps you have seen, what do you think your points should look like? Think in terms of color, shape, and size of your symbols. Revise the Intention statement above to specify what symbols you want to use for your point layer; i.e., “Symbolize the map’s point layer as….”
10. Zoom the map to the full extent spatial bookmark (see Section 1.2 Step 12 if you need a refresher on how to do this).
11. In the Contents pane, uncheck the checkbox for the basemap layer(s) so that it is (or they are) turned off. This will allow you to better judge the appearance of the symbols of each data layer against each other.
12. In the Contents pane, click once on the name of the point layer.
13. In the Feature Layer ribbon tab’s Drawing group, click the Symbology button, or click the Symbology dropdown arrow, then click “Single Symbol” (Figure 1.20). An alternative to get to the same result is to right-click the layer name in the Contents pane, then click “Symbology”.
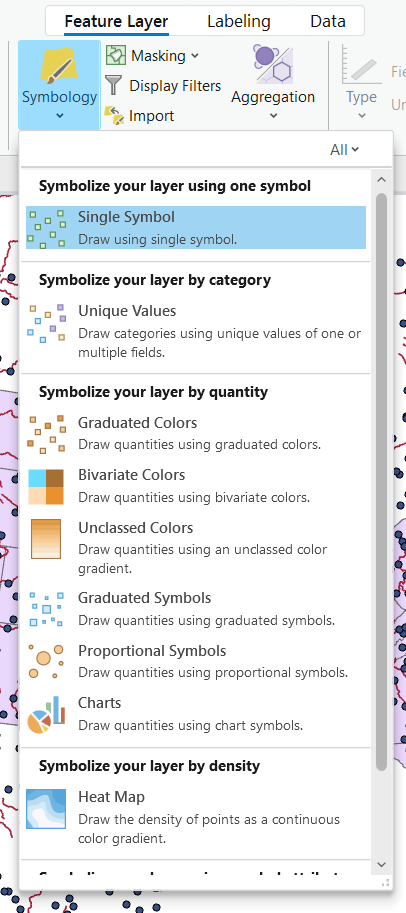
14. In the Symbology pane, click the symbol preview icon to the right of the word “Symbol” (this probably looks like a small round point symbol).
15. In the Format Point Symbol division of the Symbology pane, scroll down to browse the ArcGIS point symbol library. Try clicking on a few different symbols to see how they look on the map. Choose a symbol that matches your statement in Teachback 17 as closely as possible before moving to the next step.
16. Directly below “Format Point Symbol”, click the “Properties” tab (Figure 1.21).
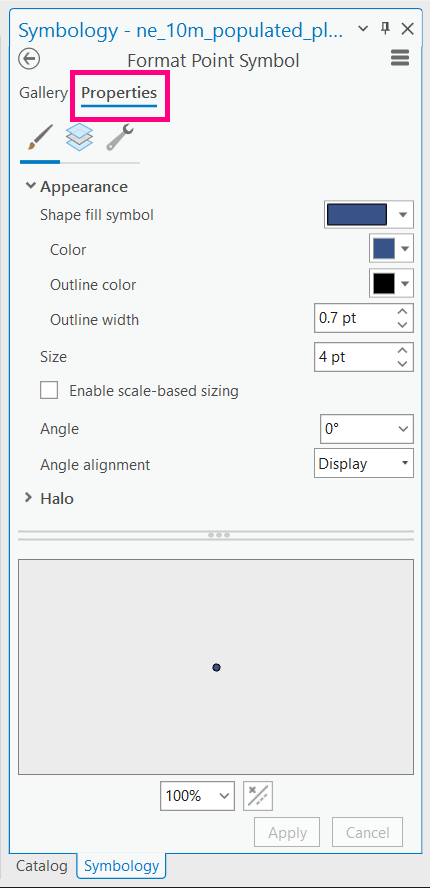
17. Adjust the color, size, outline color, and outline width of your chosen point symbol, then click the “Apply” button at the bottom of the pane to see the changes on the map.
20. Save the project.
Symbolize the map’s line layer.
21. On a piece of paper, write a longer version of the intention statement above, as you did for your point layer in Teachback 17, to specify what you want your line symbols to look like. (You do not need to record this statement as a Teachback answer).
22. In the Contents pane, click the layer name of the line layer.
23. In the Symbology pane, click the symbol preview icon to the right of the word “Symbol”.
24. In the Format Line Symbol window of the Symbology pane, you can choose a symbol from the gallery that comes close to your intended symbol, or skip to the next step.
25. Click the Properties tab.
26. Adjust the line symbol to your liking. Click the “Apply” button after each adjustment to redraw the symbols on the map.
27. When you are satisfied with your line symbols, save the project.
Symbolize the map’s polygon layer.
Polygons are slightly different than both points and lines, in that they have two elements to consider: the outline (or border), and the area fill. The fill may be a solid color, a pattern, or absent, allowing what is underneath to show through. Separately, the line may be solid or dashed and can vary in width. It is worth thinking about each of the components of your polygon symbols separately, as symbols unto themselves.
28. On a piece of paper, write down what your polygon symbols will look like. Specify both the fill and outline of the symbol.
29. In the Contents pane, click the layer name of the polygon layer.
30. In the Symbology pane, click the symbol preview icon to the right of the word “Symbol”.
31. Under the Properties tab of the Format Polygon Symbol division in the Symbology pane, adjust the fill color and outline of the polygons. Click the “Apply” button after each adjustment to redraw the symbols on the map.
32. When you are satisfied with your polygon symbols, save the project.
Teachback 18
- How close do your final symbols for each layer look to the intention you wrote down for each one? If you ended up with something different, explain why.
- How long did it take you to create symbols you are satisfied with? Explain your process.
What if there are just too many features on the map?
You may run into a situation where no matter how you adjust your layer symbols, your map just looks cluttered with too many features at the scale you want to use. For instance, the map I am making to provide the examples in this chapter uses datasets that include rivers and cities worldwide. I would prefer to only show rivers and cities within the continental United States, and to only show the largest cities without many of the smaller and mid-sized ones that are included in the data. While there are ways to do these things in ArcGIS Pro, they involve some knowledge of spatial analysis and attribute queries, topics that are beyond the scope of this introductory chapter. Thus, they will be covered in later chapters, and you may wish to return to and edit this first map after learning about them. For now, here is a preview of the tools you can use to accomplish these intentions.
Definition Query: A definition query limits the features shown for a particular layer to just those that meet certain criteria. For example, I could create a definition query for my point layer to show only cities ranked as class 3 or bigger; this would remove most of the cities in the dataset from my map while keeping the largest cities on it. The process of creating a definition query is covered in Section 3.8.
Layer Clip: The most efficient way to limit features to a certain bounded area is often to perform a clip operation, which extracts only features that lie within the specified boundaries from the original dataset. For instance, I could run a clip operation on my cities layer, and another on my rivers layer, using my U.S. states layer as the clipping boundaries. This would result in two new datasets containing only features that lie within U.S. states. Clipping is covered in Section 4.1.
Select By Location: This button in the Map ribbon tab allows you to select only the features from a given layer that meet certain location criteria you specify, such as intersecting or being within features from another layer. The selected features can then be exported to a new layer using one of two tools in the Data ribbon tab: Layer From Selection creates a new layer from the original dataset, and Export Features writes an entirely new dataset containing the selected features.
Further Resources
Additional information about adjusting the layer ordering and advanced symbol layer drawing is available on the ArcGIS Pro Help website “Symbol layer drawing” page. Additional information about the options in the Feature Layer tab is available on the ArcGIS Pro Help website “Change the appearance of a feature layer” page. Additional information about symbolizing layers is available on the ArcGIS Pro Help website “Symbolize feature layers” page.
Commonly used map design strategies that aid comprehension by being familiar to map users
A statement limiting the features within a layer that are shown on the map based on specified attribute criteria
A spatial analysis operation that extracts features from one dataset that lie within the boundaries of another dataset or its features
