
Access Chapter 2 – Retrieving Information From a Database
- Query Basics
- Types of Queries
- Sorting Queries
- Access Reports
Query Basics
Queries are far more powerful than the simple searches or filters that might be used to find data within a table. This is because queries can draw their information from multiple tables. The real power of a relational database, like Access, lies in its ability to quickly and easily retrieve and analyze data by running a query. Access queries allow users to pull information from one or more tables based on a set of search conditions the user defines. A common synonym for the word query is: question or inquiry. Queries essentially ask questions of databases. Queries do not store data. Therefore, a major benefit of queries is the ability to save a query to be re-ran at a later time after table data has been updated. This eliminates the need spend time recreating all of the fields and criteria desired to answer a popular question, such as a customer calling frequently to check on their latest account balance.
Queries can be something simple, like list all names in a table, or something a little more complex, like list all products that are priced over certain amount. A query can be very simple or very complex, depending on the user’s requirements. As tables grow in size they can have hundreds of thousands of records, which makes it impossible for the user to pick out specific records from that table without a query. The tricky part about queries is that one must understand how to construct one before one can actually use them.
When a query is ran, the results are presented in a table, but when a query is designed a different view is used. This is called Query Design View, and it lets users see how the query is put together. While the Simply Query Design Wizard can be used to display fields from one or more tables or queries with the option to choose a detailed or summary report, the wizard is limited by its inability to select data criteria. This is why most Access queries are created in Query Design View, as this allows for far more complexity to be added to create complex simple to complex queries.
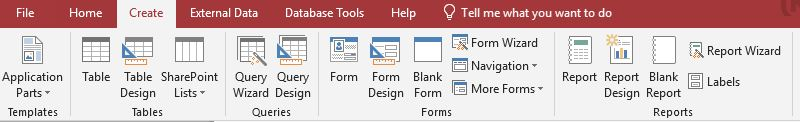
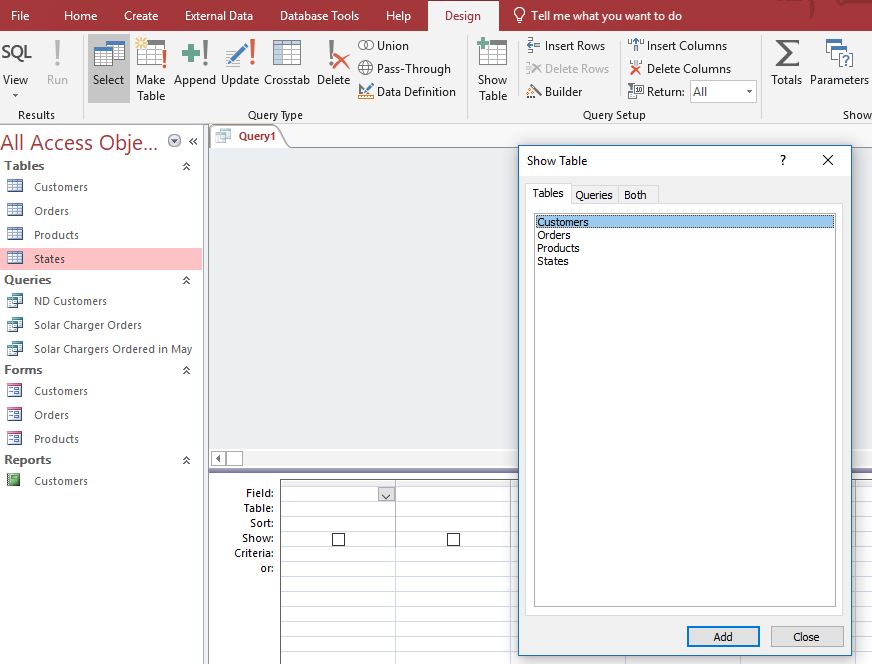
After clicking the Query Design button on the Create tab, the Query Design View opens and by default the Show Table dialog window appears with a list of available tables and queries that can be added to build the query. Select one or more tables that contain the data desired to produce the answers to the potential questions. However, only add tables that contain fields that you intend to add to the query design. Tables added to the query design that do not have fields in the query grid can skew the query results. The exception to this rule is if the table is needed to join two or more other tables that are part of the query design. After the Show Table window is closed, it can be re-opened by clicking the Show Table button in the Design contextual tab.
The next step to creating a query is to add the fields from the tables/queries into the query design grid (at the bottom of the window). Fields can be added by double-clicking the fields from the tables in the Object Relationship pane. A user can also drag a field from the table to the grid. A field can also be selected from the Field drop-down list in each column of the query design grid. If the fields are added in the wrong order, the column can be deleted or moved by clicking the top of the column and dragging the field to the appropriate location.
Types of Queries
Numerous queries from simple to complex can be created. A few of the more popular queries include:
-
-
- Single-Table Select query
- Multiple-Table Select query
- Range query
- Complex query
- Totals query
- Action query
- Parameter query
- Crosstab query
-
The simplest query is a Single-Table select query. A single-table query is based on only one table. It is essentially the same as an advanced filter applied to a table. To create a query in Design View follow these steps:
-
-
-
- Add the data source(s). This can include table(s) and/or queries from the Show Table dialog window. For a single-table query, only one table will be selected.
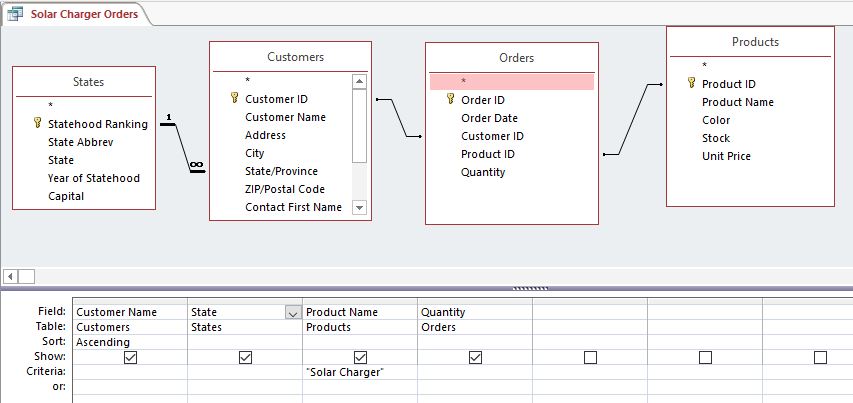
- Join related data sources: Access does not automatically create joins between queries and tables that are not related. If Access does not create joins when data sources are added, joins should be created manually. Data sources that are not joined to any other data source can cause problems with the query results. To add a join, drag a field from one data source to a corresponding field on another data source. Access displays a line between the two fields to show that a join has been created. Note: the graphic below is NOT an example of a Single-Table query. A Single-Table query would only have one table, so a join would not be applicable.
- Add output fields – Double-click or add a field from a data source in the upper pane of the query design window down to the Field row of the design grid, in the bottom pane of the query design window. To quickly add all fields down to the Field row of the query design grid, double-click the table or query name from the upper pane to highlight all the fields in that source and then drag them all down to the design grid at the same time. Alternatively, double-click the asterisk in the table.
- Specify criteria – (Optional) Use the Criteria: and/or Or: rows in the grid to limit the records that the query returns based on whether data from the fields meet the specific criteria. Non-Select queries utilize this row extensively.
- Execute (Run) the query – To see the results of the query, click the Run button on the Query Tools Design tab. Access will display the query results in Datasheet view. To make additional changes to the query, click the View button to return the Query Design View to make necessary edits before re-running the query. If the query is complete, click the Save command in the Quick Access toolbar. When prompted to name it, type a descriptive name and click OK. The new query should now appear in the Navigation Pane in the Queries object group.
-
-
As previously stated, a relational database must have multiple tables. Therefore, Multiple-Table Select queries are far more common than Single-Table queries. The key to these queries is adding tables or queries that are related through joins via a common field. This may require a little planning before composing at the computer. Determine what information is needed for output, and then pinpoint which tables contain the fields needed to produce the information. Further analysis may reveal that criteria might be needed to streamline the results. The query in the previous graphic uses fields from four related tables.
A select query with criteria that matches a range of values is called a range query. This type of query relies on relational operators to restrict the query results. When a range query compares text, alphabetical order is used to determine which data matches the criteria. For example, to return all used vehicles less than $10,000 from a database of used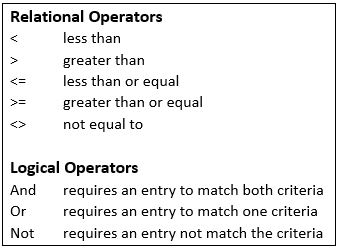 vehicles, the criteria would be < 10000. Note the lack of a dollar symbol or comma delimiter? Adding a $ in front a number would change the datatype from a Number to a Text data type. Another example using the States table that tries to return results that do not include North Dakota results would use a criteria such as <> “ND”. Using the quotation marks indicates that the criteria is of the Text data type.
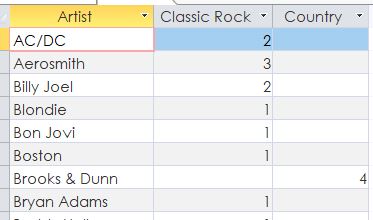
A complex query is any query that uses criteria in multiple fields. Criteria can include relational operators as well as logical operators. If criteria exists in the same row, the And operator is implied. The Or operator can be used in the Criteria row or using the Or: row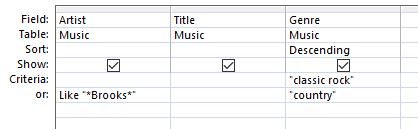 below the Criteria: row. Complex queries often utilize wildcard characters to add additional complexity. Complex queries sometimes include the same field twice to accommodate additional criteria. In these situations, the Show checkbox is often cleared to prevent the field from display twice in the query results. The graphic above illustrates a query that includes AND and OR criteria, as well as wildcard characters. The results should produce a list of music CDs that include any Classic Rock CDs and any Country CDs from Artists that include the name “Brooks” in any combination. This would include an Garth Brooks CDs as well as any Brooks and Dunn CDs.
There are times when setting simple criteria won’t generate the desired results , especially when working with numerical values. The objective may be to see the query results grouped or counted in some way. A Totals query uses a type of function called an aggregate function to sum the data in a query result set. Aggregate functions perform a calculation on a column of data and return a single value. Access provides a variety of aggregate functions, including Sum, Count, Avg (for computing averages), Min and Max. To sum data, add the Sum function to the query, to count data use the Count function, and so on. The following example will illustrate how many of various bakery menu items 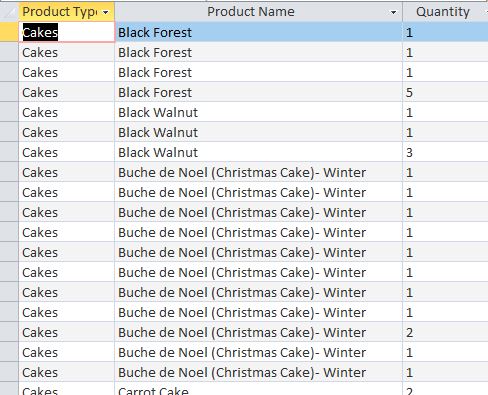 have been ordered. The query datasheet results at right display the quantity of various cakes ordered on separate order transactions. Creating a Total query will group all identical menu items from separate orders, and then by using the Sum function, Access will add values in the Quantity field to calculate the total number ordered for each menu item. To create the Total query, the first step is to click the Totals button
 ![]()
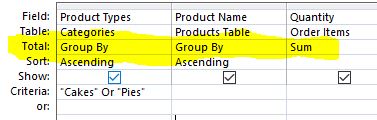 from the Show/Hide group of the Query Tools Design tab. This will add a Total: row to the query design grid. The default values in the row are set to Group By. Clicking the drop-down arrow in the Quantity column of the Total: row, and
 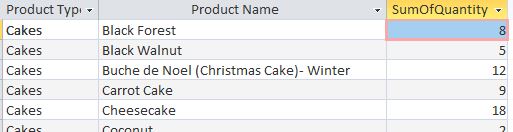 selecting Sum will accumulate (add) the quantities of products ordered. Executing the query by clicking the Run button will display the results in the query’s datasheet view as shown above. Note the Quantity field name changes to SumOfQuantity.
In Access, queries can do a lot more than just displaying data. Through the use of assorted Action queries, Access can perform various actions on the database data. Microsoft Access provides 4 different types of Action Queries:
-
-
- Append –
 Retrieves data from one or more tables and adds the data to another table.
 - Update –
 modifies or updates records. Criteria can be specified to limit which records are updated, but if no criteria is specified, all records will be updated.
 - Delete –
 useful for quickly deleting a set of data on a regular basis.
 - Make-table –
 retrieves data from one or more tables, and then loads the result set into a new table. That new table can reside in the database currently open, or a new database can be created.
- Append –
-
Action queries change data based on some set of criteria. Action queries can delete records, update data, append data from one or more tables to another table, and make a new table. Users must be cautious because once the query is executed, the data is changed and cannot be undone. Experts advise to make a backup of the database before proceeding with significant action queries.
A parameter query retrieves information in an interactive manner by prompting the end user to supply criteria before the query is run. If a particular query is used often but modified slightly, a parameter query may be more efficient. When the query is run, the user is first prompted to enter a parameter (or multiple parameters). Once the parameter has been supplied, the query can return the results, based on the parameter provided. The key to creating parameter criteria is to enter the parameter prompt inside square brackets, such as: [What’s your favorite color?]. The square brackets will cause a parameter dialog box to open when the user runs the query. The text inside the square brackets will be displayed to the user, and an input field will be displayed for their input. If the user enters purple in the prompt, all records in table that store the data: purple will be returned 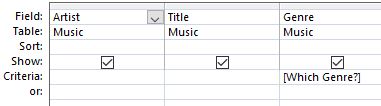 as the query results.
In the example to the right, parameter criteria is entered in the Genre field’s Criteria cell. When the query is executed, Access will display the following prompt: If the user were to 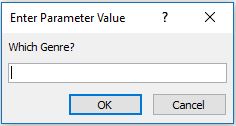 enter the data: Pop in the prompt, the following results would be displayed the query datasheet view. (the data entered into the prompt is not case-sensitive)
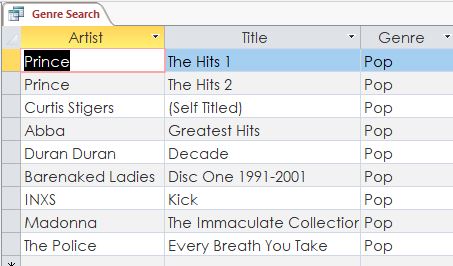
A crosstab query is a special type of query that calculates a sum, average, or other aggregate function, and then groups the results by two sets of values — one down the left side (row headings) of the datasheet and the other across the top (column headings)- much like an Excel spreadsheet. When building a crosstab query in Design view, use the Total and Crosstab rows in the design grid to specify which field’s values will become column headings, which fields’ values will become row headings, and which field’s values to sum, average, count, or otherwise calculate.
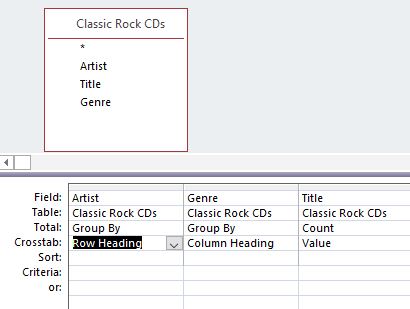
In the following example, the Music database will calculate a Count on the number of CDs are possessed by Artist – using the Row Headings and by Genre – using the Column Headings. The Title field will serve as Value field. The data source is an existing query named Classic Rock CDs, which provides the fields necessary to create the cross-tab query. After executing the query the datasheet results appear similar to:
A crosstab query does not always populate all of the fields in the result set because the tables used in the query do not always contain values for every possible data point. It is possible to enter an expression in the Criteria row to limit the results for the column heading field. However, using a criteria expression with the column heading field does not limit the number of columns returned by the crosstab query. Instead, it limits which columns contain data. For example, suppose you have a column heading field that has three possible values: red, yellow, and blue. If you apply the criterion =’blue’ to the column heading field, the crosstab still displays a column for red and a column for yellow, but only the column for blue contains data.
Sorting Queries
Sorting in Access is the process of rearranging records in a specific order. Sorting data can create a significant impact on the usability of Access queries and reports. Sorting can occur before or after executing a query. In the datasheet view, a query can be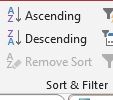 sorted after running the query by using the Sort Ascending and Sort Descending buttons in the Sort & Filter group of the Home tab. To create more complex sorting criteria, use the Query Design window to create multi-field sorts.
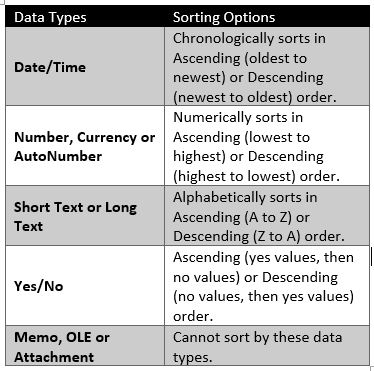 Multi-field sorting requires the use of primary, secondary and potentially, tertiary sorting fields. Using Access’ Query Design View, fields can be arranged in any order to accommodate the desired order. It is important to comply with the sorting rules inherent with the various data types of each field (see table to the left). Access will sort the fields in the Query Design from left to right. However, this can by manipulated by adding duplicate fields to the grid, specifically for sorting purposes. The key to this strategy is to utilize the Show checkbox for these sort-only fields. Clearing the Show checkbox will prevent these fields from displaying the Datasheet results, but their sorting mission will still be accomplished! Using Query Design also affords the ability to sort one field in Ascending order and another in Descending order in the same sort process.
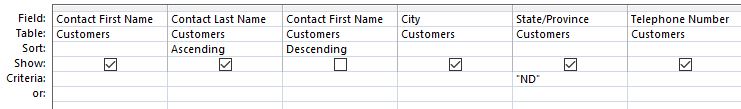
In the example below, the goal is to sort the records primarily by Last Name. However, some records might share the same Last Name. Therefore, if there are duplicates, the First Name field will serve as the secondary sort criteria. Furthermore, it is desired that the results set display the records with the First Name field to the left of the Last Name field. This necessitates the use of a duplicate First Name field that will only be used for sorting purposes. Also notice that the Show checkbox is cleared for this duplicate field, so as not to confuse the layout of the results set. Hiding a field, by clearing the Show checkbox. can also be used for applying Criteria restrictions on a field that is not desired to be displayed in the results set, but is needed to narrow the results. This is popular with the sensitive data, like Salary or Credit Limits.
Access Reports
Utilizing Access to analyze data results in lots of information. This Information needs to be shared – often will people who do not, or should not, have rights to utilize the Access database. Access reports organize and present data in a reader-friendly, visually appealing format by using data from any queries or tables in the database. The tables or queries that provide the underlying data are also known as the report’s record source. A report is a database object that comes in handy when you want to present the information in your database for any of the following uses:
-
-
- Display or distribute a summary of data.
- Archive historical information.
- Provide details about individual records.
- Create labels.
-
There are four different report views in Access. Two are essentially print views and the other two are report building views. As with all other Access objects, you can toggle the view using the buttons at the bottom right of the screen, or by using the View button on the Ribbon. The four views include:
-
-
- Report view – shows how a report would appear with dummy data using a continuous page layout.
- Print Preview – allows users to see what the report will look like when printed. This view can be used to change the page layout, including the report orientation.
- Layout view – allows users to edit the report design while it contains live data. Considered the most intuitive view to use for report modification, this view can be used for nearly all potential changes to a report in Access.
- Design view – allows users to view and change any aspect of the report structure, but not the data. This view displays any expressions that are used to generate content, and displays the header and footer bands for the report, page, and groups.. This is the preferred view for adding controls to the report, such as labels, images, lines and rectangles.
-
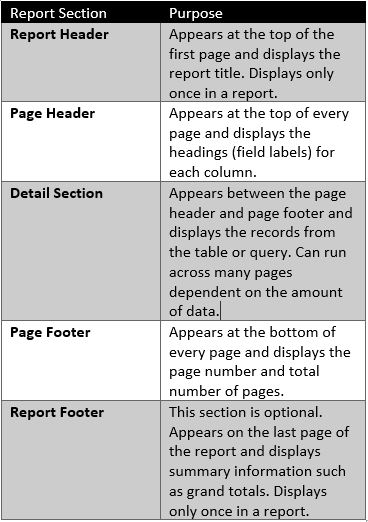
The design of a report is divided into sections that can be modified in the Design view. Reports created by using the Report button are plain and simple, and have several sections, as detailed in the table to the right. More complex reports created using the Report Wizard can also have multiple group header and group footer sections to print grouping details and summary information.
Reports can be designed and formatted in a similar way to forms. When you create a report, four new tabs appear in the Report Layout Tools section of the Ribbon specifically for working with reports.
- Design: Group and sort elements in the report, add text and links, insert page numbers, and modify the sheet’s properties.
- Arrange: Adjust the table to be stacked, tabular, etc.; move rows and columns up an down or left and right; merge and split columns and rows; control the margins and bring elements to the “front” or “back” in a layering format.
- Format: Includes regular word processor formatting tools like bold, italic, underline, text and background color, number and date formatting, conditional formatting, etc.
- Page Setup: Allows adjusting of the page’s overall size and toggling between landscape and portrait.
Another popular approach to creating reports is to use the Access Report Wizard. The Report Wizard provides more flexibility than by simply using the Report button. The Report Wizard guides users through a series of questions and then generates a report based on these answers. Users can choose the tables and fields, group the data, sort the data, summarize the data, choose a layout and orientation, apply a style, and title the report. Grouping data puts all of the values in a field into a group based on the field’s value. By using the Report Wizard, users can create up to four sort levels. If the data has been grouped, the option exists to summarize the data by displaying the sum, average, and minimum or maximum value for each numeric field. Choose to have the report display just the summary data or each detail line and the summary data. Note: Users can also add grouping, sorting, or totals by using the Group, Sort, and Total pane while the report is open in Layout view or Design view.
To print a report, right-click the report in the Navigation Pane and choose Print Preview from the shortcut menu. Print Preview command options include:
-
-
-
Print the report
- Adjust page size, margins or orientation
- Zoom in or out, or view multiple pages at a time
- Refresh the data on the report
- Export the report to another file format.
-
-
To save paper, or to send a print job to a professional printer, or send the report via e-mail, you can create a .pdf or xps format of your report: On the Print Preview tab, in the Data group, click PDF or XPS. Reports can be saved as an object in the Navigation Pane, and at later date, updated and re-printed. Unlike Access queries, the page settings are maintained in Access reports when saved.
