PowerPoint Chapter 1: Creating Presentations
- Planning a presentation
- Adding and deleting slides
- Adding slide text versus slide notes
- Creating bulleted and numbered lists
- Comparing presentation views
- Utilizing tables and charts
- Inserting and modifying graphics
- Creating a photo album
- Inserting and modifying shapes
- Utilizing WordArt
- Inserting SmartArt
- Inserting slide and handout footers
- Apply design themes
- Formatting the slide background
- Replacing text and fonts
- Printing a presentation
Planning a Presentation
Microsoft PowerPoint is a presentation software program used to organize and present information to others. PowerPoint is a popular presentation aid that utilizes visual and stimulating elements to accompany a presenter’s communication through slides and multimedia tools. Planning a presentation necessitates defining the purpose of the presentation, identifying the target audience for the presentation, and deciding the type of output for the information.
The purpose of the presentation can generally be categorized into either of two general areas. The most common purpose for a presentation is to inform an audience by providing facts and figures. Informational presentations often include slides with tables, charts, graphics and text. Classroom lectures that utilize PowerPoint are typically information-type presentations. A secondary purpose of presentations is to persuade or sell the audience on an idea. Sales and political speeches fall into this category of persuasive presentations. Style is almost as significant as content for persuasive presentations. Therefore, design themes are important considerations for this type of presentation.
Another important consideration when planning a presentation is to determine the audience, including the venue in which the presentation will occur. The characteristics of the audience will help distinguish the type of vocabulary, font size, and design themes that would be appropriate. An audience of colleagues will allow more flexibility versus a group of customers, in terms of language and content. Understanding who the audience is, and why they are there can really influence the design and content of a presentation. The venue also influences the design of a presentation. A large room will require larger fonts and louder audio for the presentation to be understood by the audience. Conversely, a smaller room make necessitate a softer design. The presenter should also take time to ensure that the venue has ample and compatible audio-visual equipment (projector, cables, screen, speakers, etc.) to successfully run the presentation.
Get to know the elements of the Microsoft PowerPoint window! Note the similarities to Word and Excel!
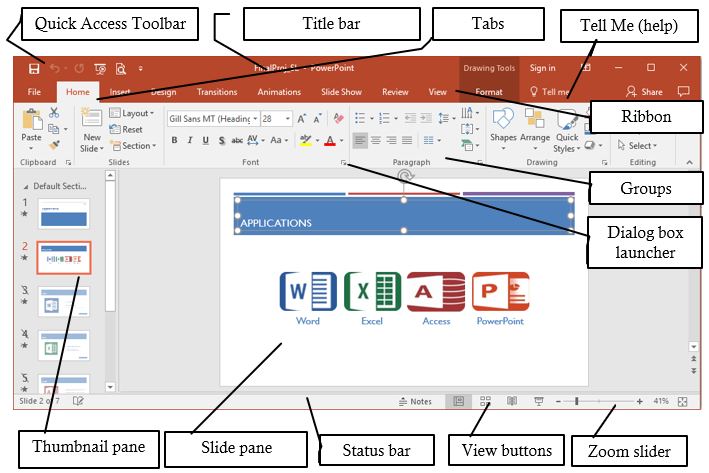
- The Quick Access toolbar contains one-click buttons for saving, undoing, redoing, and print previewing a presentation. You can easily modify this toolbar to add your most frequently used commands. Just click the down-arrow on the right edge to customize this toolbar!
- The title bar displays the name of current presentation, and the program. A new presentation will default with a temporary file name, such as Presentation1 until you save the file with a different name. The Minimize, Maximize and Exit buttons appear on the right edge of the title bar.
- The Tell Me tool is a new way to get assistance with specific tasks in PowerPoint. When the user starts typing, PowerPoint suggests commands that are related to your keyword(s). The tool is context sensitive, and integrated into your current presentation versus opening a separate window. Therefore, if you type insert picture into the field, and click the resulting command, PowerPoint will open the Insert Picture dialog window without explaining the navigation instructions.
- The Ribbon interface is a set of toolbars at the top of the window in Office programs designed to help you quickly find the commands that you need to complete a task. The ribbon displays a combination of icons and tabs. Commands are grouped under multiple tabs. Some commands are so extensive that they need additional windows to display their entire functionality. The dialog box launcher icon will open these windows. Contextual tabs will appear only when the user needs them, such as when a picture is selected, or a table is inserted.
Adding and Deleting Slides
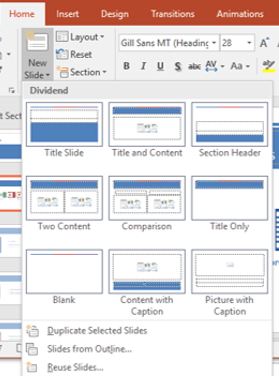
New slides can easily be added to a presentation by clicking the bottom half of the New Slide button in the Slides group of the Home tab. If the top half of the New Slide button is clicked, the default slide layout (Title and Content) will be inserted into the presentation. By clicking the bottom half of the button, a gallery of several different slide layouts will appear.
The type of content the user intends to add will dictate which slide layout is selected. Most slide layouts include one or more placeholder to guide the user where to add content. Placeholders can contain different types of content, including text, graphics, tables, charts, and videos. Placeholders can be resized, reformatted or deleted. The most common slide layout (Title and Content) has two placeholders. The user simply needs to place the cursor inside the placeholder and 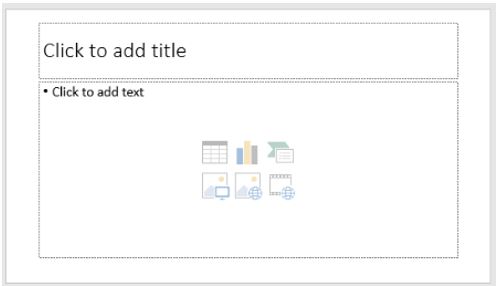 begin typing to add text, or click an icon to add an object. PowerPoint automatically sizes the text as it is typed to fit within the placeholder.
The AutoFit icon ![]() is displayed next to a placeholder when more text than can fit is typed.
is displayed next to a placeholder when more text than can fit is typed.
The alignment, font, size, and other formats can be applied to the selected text in a placeholder by using the Mini toolbar or the Home tab. A layout can be changed by clicking the Layout button to the right of the New Slide button, and choose a different layout. To delete a slide, right-click the slide in the thumbnail pane, and choose Delete Slide from the shortcut menu.
Adding Slide Text vs Slide Notes
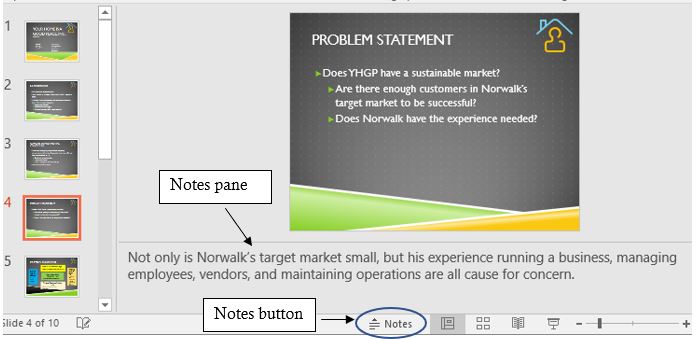
While text can be added to slides via placeholders in various slide layouts, text can be added directly to the Notes pane to create speaker notes for the presenter of the slide show. Maintaining a minimal number of slides requires that each slide only contain summary text, not details. The details need to be added orally through the presentation speaker. The data in the Notes pane does not appear in Slide Show view. The Notes pane can be opened or closed by clicking the Notes button on the status bar.
Creating Bulleted and Numbered Lists
The Title and Content slide layout is both the default and the overwhelming most popular slide layout for most slides in a presentation. This the root cause of why so many PowerPoint presentations bore their audiences with mundane amounts of text. The worst offense is when users simply write sentence upon sentence of text, which often gets read to the audience by the presenter. (Not a crowd favorite!) A better approach is to create presentations which utilize bulleted and numbered lists to help organize text, or show sequential processes. Too many slides of the same format can exhaust the audience, so use lists in moderation. However, when used with animation (discussed in the next chapter), lists can really help manage the flow of information by synchronizing the visual elements of the slide show with the verbal accompaniment of the speaker.
As defined in the Word chapters, bulleted lists differentiate from numbered lists in that numbered lists demonstrate sequencing, whereas bulleted lists simply imply that each item is part of an non-ordered group. Bullets and numbers can be formatted using custom symbols and number formats to synchronize with the presentation design.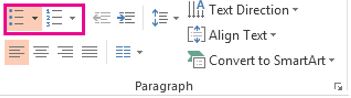 Bullets and numbers can also be indented to create sub lists. The Paragraph group contains the commands to increase and decrease the indentation of bullets and numbers.
Comparing Presentation Views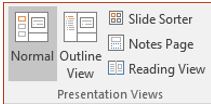
PowerPoint can display its slides in several different views, which can be accessed from the View tab, the Status bar, or the Slide Show tab. Each has its own unique purpose as described in the table below. ![]()
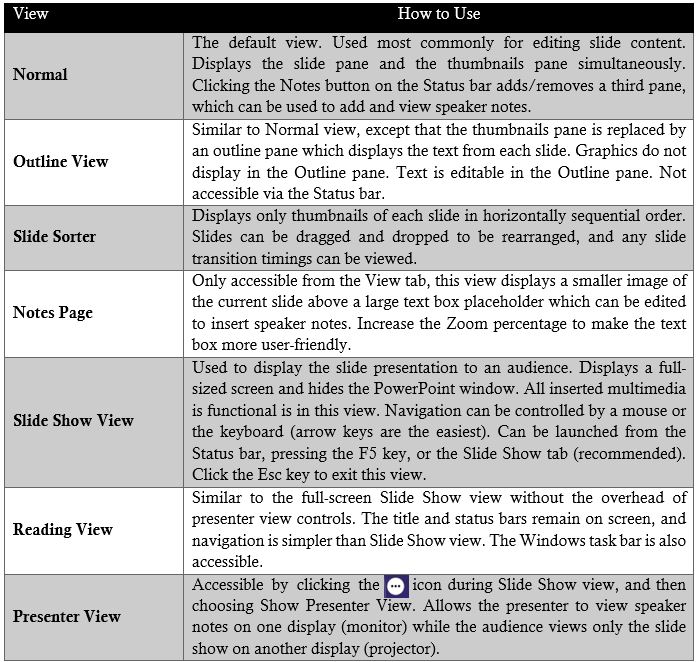
PowerPoint offers a variety of views to display content depending on the situation. Some views help create a presentation, while others help deliver a presentation. Choose wisely!
Utilizing Tables and Charts
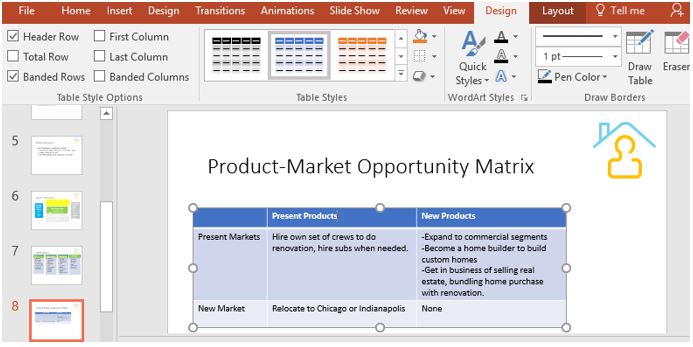
The organization of a PowerPoint presentation necessitates that the presentation be concise and meaningful. Tables and charts represent an opportunity to present a lot of data in an organized, structured graphic. Tables can be created and inserted into a slide in a similar process as Word tables. Tables can be inserted from the Insert tab, or by clicking the Table icon ![]() from a Content layout placeholder. Two contextual tabs are available for formatting the table, similar to Word. Adding table styles that match the theme of the presentation is desirable. Creating tables through this process is ideal for tables full of text, such as the table in the illustration below. Tables can also be created in Word, and then copy and pasted into PowerPoint. Either way, tables are a great way to consolidate a lot of information into a single slide.
from a Content layout placeholder. Two contextual tabs are available for formatting the table, similar to Word. Adding table styles that match the theme of the presentation is desirable. Creating tables through this process is ideal for tables full of text, such as the table in the illustration below. Tables can also be created in Word, and then copy and pasted into PowerPoint. Either way, tables are a great way to consolidate a lot of information into a single slide.
 If the table contains a lot numerical data, it might make more sense to create the table in Excel, and paste it into PowerPoint. Data can be edited in PowerPoint using Excel formatting tools. Data can even be linked so that when the Excel file is updated, the PowerPoint slide is also updated. If the data is not linked, it is considered to be an embedded object. Embedded objects become part of the PowerPoint file and, after they are inserted, they are no longer part of the source (Excel) file.
Charts are used to illustrate numerical data, which can help the audience visualize patterns, relationships, or trends in data. The decisions about linking or embedding a table are very similar to the decisions regarding inserting charts. Charts can be created in PowerPoint or Excel, but most are typically already created in Excel and simply need to be pasted into PowerPoint. Then comes the decision about embedding or linking the chart. When a chart is selected on a slide, options on the Chart Tools Design and Format contextual tabs can be used to modify the look of the chart.
Inserting and Modifying Graphics
Graphics can be utilized to make a presentation more interesting and informative. If the PowerPoint developer is trying to keep the length of a presentation to ten or fewer slides, keep in mind that many believe that a picture is worth a thousand words! Sometimes graphics can be more informative than words and enhance a presentation by evoking emotion in the audience. PowerPoint graphics typically refer to pictures, and pictures can take the form of digital photographs, clip art, or computer-generated imagery (CGI). Digital photographs are realistic images captured with a digital camera or scanned to a file by a scanner. Clip art images are line-based drawings that are intentionally non-realistic. An example of computer-generated image is a logo, typically produced in a software program such as Adobe Illustrator, or a 3-D graphic, such as an avatar.
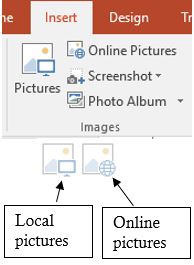
Inserting graphics into PowerPoint is very similar to Word. However, in addition to using the Images group options on the Insert tab, users can also insert a graphic via an icon in a content placeholder. Graphics can either be inserted from the user’s own device, or from online sources.
Each type of graphic has its pros and cons. Clip art can be popular because their simplicity results in a compact file size, which can be increased or decreased without distortion. Additionally, the unrealistic nature of these images makes them appropriate for representing sensitive topics that require anonymity. Digital photos are very realistic, which inspire authentic reactions. However, these images result in large files that can be difficult to transfer among devices. Additionally, resizing a digital photo can create undesirable pixilation.
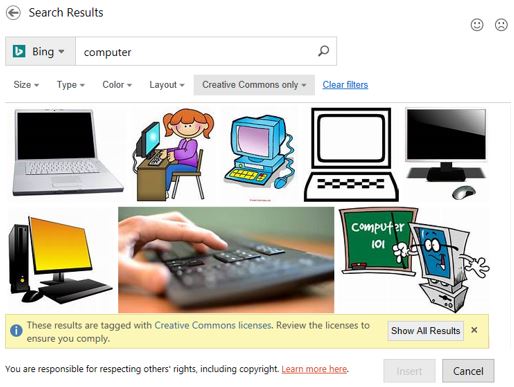
Caution should be used to ensure that graphics are used appropriately by only including images that are relevant to the message being advanced. Graphics usage should also obey applicable copyright laws, especially when downloading images from Internet sources. According the U.S. Copyright Office, a copyright is a form of protection for “original works of authorship”, and is usually identified by the © symbol. Photos and high-quality artwork that has been self-produced are not at odds to copyright infringement, but images downloaded from online sources should be credited, purchased or defined as royalty-free or be accessed through a Creative Commons (CC) license. By default, Microsoft’s Bing Image search engine will only return images licensed under Creative Commons when utilizing the Online Pictures command in PowerPoint.
The robust photo-editing functionality within PowerPoint makes it easy to manipulate the size, location, and look of inserted graphics. After selecting the graphic, sizing handles will appear around the graphic, and the Picture Tools contextual tab will appear to offer a plethora of image formatting features.
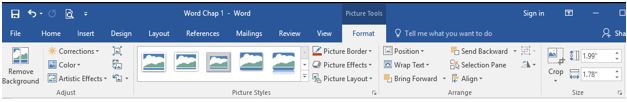
Some of the most commonly used picture formatting tools include: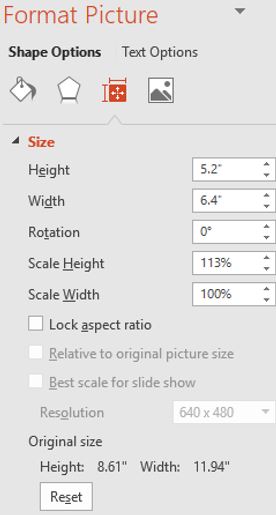
- Resizing and cropping. The easiest way to resize a graphic is to drag the sizing handles. The corner handles will increase or decrease the image’s size proportionally, whereas the middle or top/bottom handles can distort the image’s size. Specific height and width measurements can be defined in the Size group. Click the launcher to open the Format Picture pane. Clearing the Lock Aspect Ratio checkbox will allow the user to define specific sizes for the height or width without proportionally resizing the other dimension.Cropping an image results in a part of the image being removed. This is useful when an image has a lot of unwanted content that can distract from focusing on a certain aspect of an image. An image can even be cropped to fit into a specific shape. To reduce the file size of the presentation, use the Compress Pictures feature, in the Adjust group, to permanently delete the cropped portion of the image. Clicking Reset in the Format Picture pane or Reset Picture in the Adjust group will return the image to its original size.
- Corrections and Color adjustments. If an inserted picture is too dark, the Corrections feature allows the user to edit the picture’s brightness and contrast. The picture can be softened or sharpened as well to make the picture blurry or distinct. Color adjustments can also be applied to change the saturation (how vivid the colors are) and tone (the temperature – cool or warm) of a picture. Colored filters can also be overlaid to recolor a picture to fit the presentation’s theme.
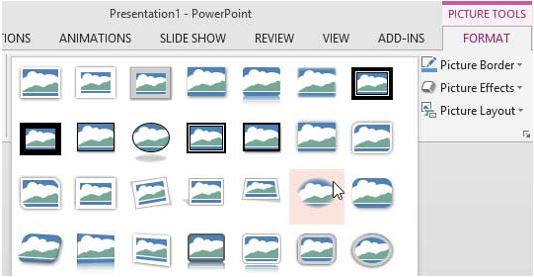
- Picture styles. Applying a picture style or effect from the numerous preset gallery options can visually enhance the way a picture appears. Picture styles make the picture look more stylish by applying a combination of borders, 3-D rotations, shadow effects or frame shapes. After selecting the picture, hover the cursor over any of the gallery choices, and PowerPoint will display a live preview of the style applied to the image. Clicking a selection will apply the picture style settings.
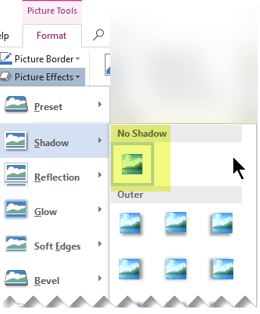
- Picture effects. Users can enhance a picture by adding effects, such as Shadows, Reflections, Glows, Soft Edges, Bevels or 3-D Rotations. To fine-tune the effect, click Options at the bottom of any effect menu. Multiple effects can be applied to the same picture, such as an outer shadow, an angle bevel and a contrasting right, perspective 3-D rotation.
Practice 5: The Solar System – Part 4
- Plan your presentation. Your goal is to create a slide show to accompany your presentation regarding the planet Earth. The content will include slides with text, a table and some photos of various continents. The design will be basic. The audience is your fellow classmates.
- Open the recently edited data file Continents.pptx from your data files.
- View the presentation in Slide Sorter view, and then revert back to Normal view.
- In the title slide, add your name to the subtitle placeholder.
- Insert a new Title and Content slide after the title slide (slide 1). Add the title: Earth’s Continents, and then add seven bullets to the Content placeholder with the text: North America, South America, Europe, Africa, Asia, Australia, Antarctica. Make the title font 54pt.
- In slide 3 (North America), add an online picture of North America to the content placeholder using the Online Pictures icon.
- In slide 4 (South America), change the size of the graphic to have a height of 4.5”. Let PowerPoint adjust the width proportionately.
- In slide 7 (Africa), apply a Brightness +20%, Contrast
 -20% correction adjustment.
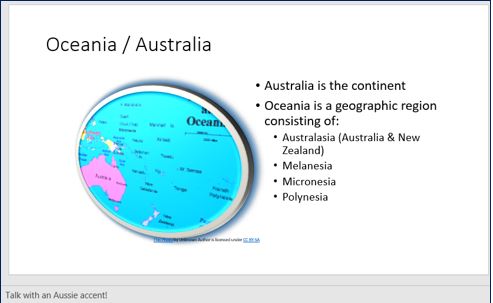
 - In slide 8 (Oceania/Australia), apply a Metal Oval picture style, and a Glow 18pt, blue picture effect, as well as a Perspective: Turned Left, Tilted Up 3-D Rotation picture effect.
- Add the following speaker not to the Oceania/Australia slide: Talk with an Aussie accent!
- Change the layout of the Oceania/Australia slide to a Title and Two Content layout. In the new content placeholder, add the following text bullets by referring to the illustration to the right:
- Save the presentation with the file name My Continents.pptx to your default local folder.
Creating a Photo Album
If your presentation’s purpose is more slanted towards entertaining versus educating, then a photo album is a popular feature that might facilitate that entertainment. PowerPoint’s photo album allows users to load a bunch of digital photos into a single file, one photo per slide, formatted consistently, with a variety of formatting options. Photo album is a great tool for creating self-running presentations that display photos from an event or a family memory (graduation, wedding anniversary, funeral, etc.) PowerPoint creates a new presentation file when a user chooses to create a photo album.
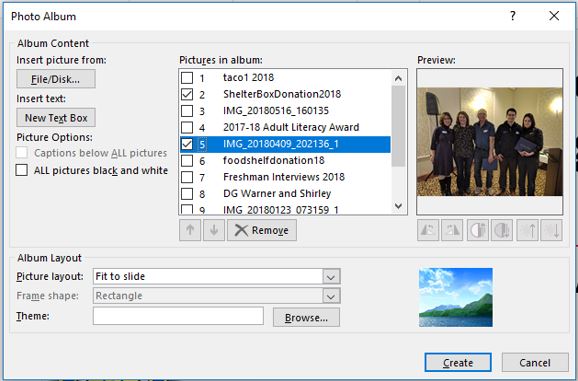
To start, take note of where the photos you want for the album are located (preferably on a local device). Then go to the Insert tab and click the Photo Album button. Once the Photo Album window opens, the next step is to insert the pictures from your device by clicking the File/Disk… button. The Insert New Pictures dialog window will appear. The user should then navigate to where the photo files reside on their device, then select multiple picture files (remember to use the Ctrl button to select multiple non-consecutive files) and choose Insert. The selected files will appear in the Pictures in Album scrolling-window in the Photo Album window. The order of the slides can be rearranged in this window or in the main PowerPoint window.
The more important decisions that should be determined before clicking the Create button pertain to the Album Layout and Picture Options. Notice how the Captions below ALL pictures option is disabled? This is due to the Picture layout currently being set to the Fit to Slide option. Choosing any other Picture layout will enable this option. Captions are a great way to add accompanying text to each slide in the album and provide explanation for the photos when no presenter is present. If this feature is skipped and needs reversing, choose the Insert tab, click the Photo Album drop down arrow, and select Edit Photo Album. The picture layout, frame shape, theme and picture options can all be redefined, and pictures can be added or deleted as well. The Insert Text Box is an alternative way to add manually add text to a separate slide versus the captions, which defaults with the operating system’s file name as the slide caption. This data can be edited for each slide via the normal PowerPoint view. Photo albums can become even more entertaining when additional (yet to be explained) functionality is added. However, these features, which demand a lot of creative attention, can become very time-consuming! The Photo Album feature was designed to work with the Windows operating system. Therefore, this feature is not available for Mac users.
Inserting and Modifying Shapes
Many different types of shapes can be inserted into a PowerPoint slide to help illustrate concepts and draw attention. Want to emphasize a certain focal point on a slide? Draw  an arrow and add a custom format! The basic shapes are found in the Drawing group of the Home tab, but more extensive selections exist from the Shapes drop-down
 ![]() list from the Insert tab. Shape categories include lines, geometric figures, arrows, stars, callouts, and banners. Once a shape is selected from the gallery, a cross-hair pointer allows the user to draw the shape on a slide. Shapes can be filled, stacked, aligned, grouped and merged using advanced formatting.
list from the Insert tab. Shape categories include lines, geometric figures, arrows, stars, callouts, and banners. Once a shape is selected from the gallery, a cross-hair pointer allows the user to draw the shape on a slide. Shapes can be filled, stacked, aligned, grouped and merged using advanced formatting.
Many aspects of each shape can be further modified, including its line gradient, line color, fill color, weight, outline, shadow and other 3-D effects. Similar to other graphics, like clip art or a photo, a shape can be resized, relocated and reset to complement the design of the presentation. Text can be added to further annotate a shape and explain a concept.
Utilizing WordArt
Keeping the audience’s attention requires using non-standard text in order to maintain interest in the presentation. Strong visual elements help hold the audience’s attention. 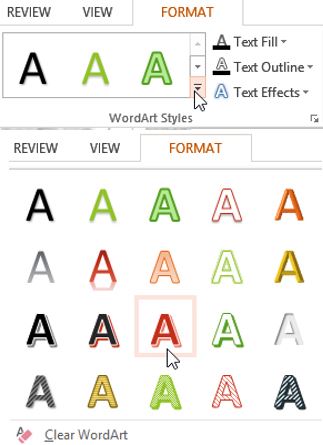 As discussed in the Word chapters, WordArt is a feature that applies decorative text styles and text effects to any text object in order to attract the audience’s attention. Features such as shadows, outlines, colors, glows, bevels, gradients, and 3-D effects can convert ordinary text into something extraordinary! The easiest way to utilize WordArt is to select an existing text object, then from the Drawing Tools contextual Format tab, click a predefined WordArt style from the gallery of choices. Clicking the More drop-down arrow will expand the gallery. After selecting a style, the text will appear in the selected style, and can be further customized by choosing text fill, outline or effect options.
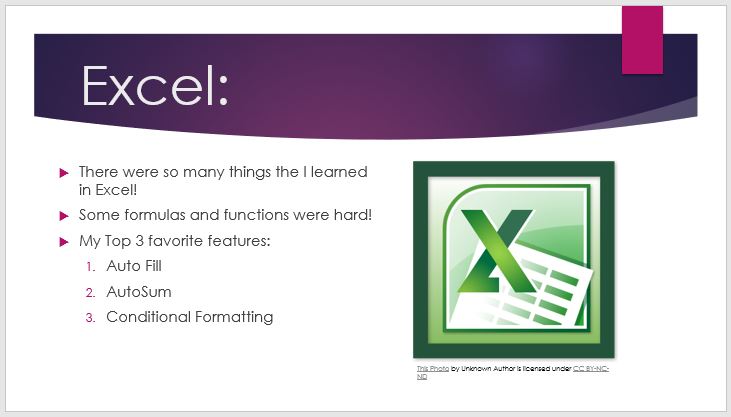
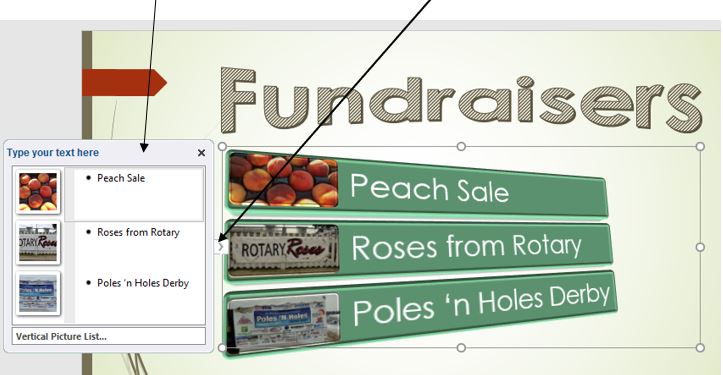
WordArt is a great replacement for title text. Notice the difference between the two titles with normal text versus WordArt with text fill color, and a transform 3-D text effect.

Inserting SmartArt
Like WordArt, SmartArt is a cross-application feature that adds appeal, design and intrigue to an Office file. A SmartArt graphic is a professional-quality diagram that visually illustrates text using a variety of shapes. Like WordArt, a SmartArt graphic can be created from scratch or text can be converted with a few simple clicks. Converting a ![]() bulleted list to a SmartArt list is very easy! To create a SmartArt diagram from scratch, click the icon on the Insert tab. A gallery of graphics will appear.
bulleted list to a SmartArt list is very easy! To create a SmartArt diagram from scratch, click the icon on the Insert tab. A gallery of graphics will appear.
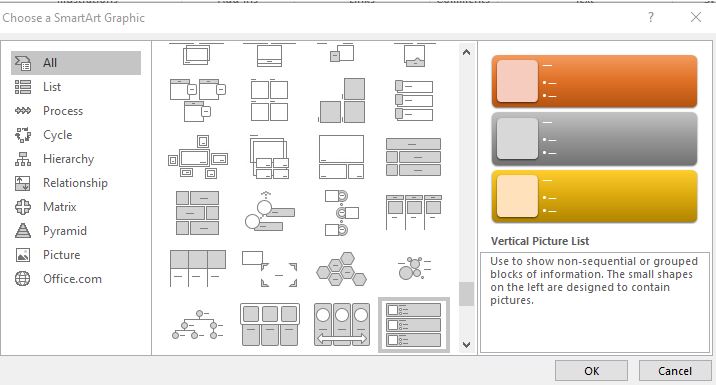
Users can choose from among many different layouts to effectively communicate a complex concept. Categories range from process and cycle diagrams to list and relationship graphics. Choosing the appropriate graphic is key, because some of these diagrams are complex, and therefore, can be more confusing than informative. Other considerations when choosing to use a SmartArt graphic include the amount of text that will be included with the shapes versus the amount of legible space available on a slide. Too many shapes can easily overcrowd a slide to the point that it is illegible. Users can quickly and easily switch layouts, so try different layouts (across types) until you find the one that best illustrates your message.
After selecting a SmartArt graphic, the diagram will replace the content placeholder of the slide. New [Text] placeholders will appear to allow the user to customize the diagram. Alternatively, a Text pane should appear to the left of the graphic to ease the insertion of text. If the pane does not automatically appear, click the arrow control on the left size of the SmartArt graphic.
After adding text, and possibly photos, additional formatting is available from the SmartArt Tools contextual Design and Format tabs. The Change Colors and SmartArt Styles options offer radical format changes. A SmartArt style is a preset combination of numerous effects, such as line style, bevel, or 3-D, which can be applied to a SmartArt graphic to create a unique and professional design.
To create a SmartArt graphic from existing text on a slide, place the cursor inside the text, click the Convert button from the SmartArt Tools Design tab, and then choose the Convert to Text option. This is a great way to liven up basic bulleted lists to eye-popping information!
Inserting Slide and Handout Footers
Slide footers represent another way to further customize the look of the presentation. Slide footers are typically displayed at the bottom of the slide, depending on the presentation’s theme. Several fields are available to be added to each slide, including the date, a slide number or a customizable text field. A combination of these fields can![]() be included or excluded. From the Insert tab, choose the Header & Footer option from the Text group to open the Header and Footer window.
be included or excluded. From the Insert tab, choose the Header & Footer option from the Text group to open the Header and Footer window.
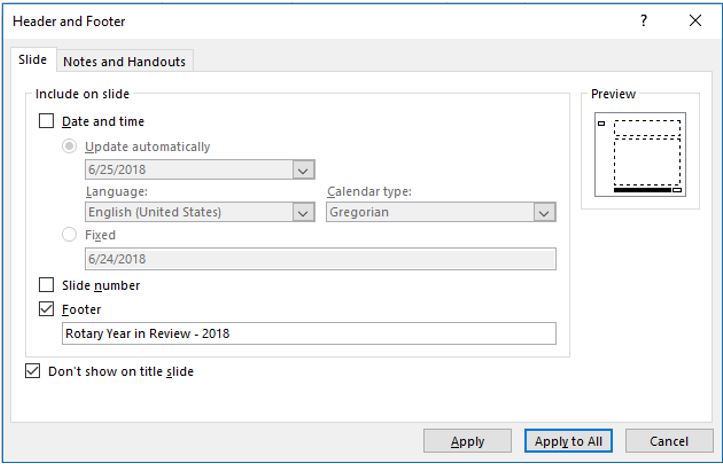
Two options that often get overlooked are the Don’t show on title slide checkbox, and the Apply versus Apply to All buttons. The Don’t show on title slide option is usually selected to prevent the footer from appearing the title slide. To assign the footer options to the current slide, choose the Apply button. Alternatively, the Apply to All button assigns the footer options to all slides, except the title (if the Don’t show on title slide checkbox is marked).
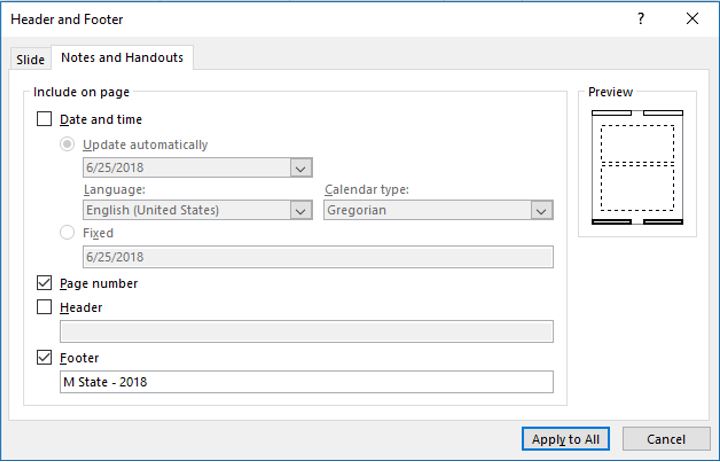
Slide footers are different than handout footers. Both can exist in the same presentation, but each has their own uses. While the slide footers appear on screen during slide shows, the Notes and Handout footer is designed for hard copy printouts.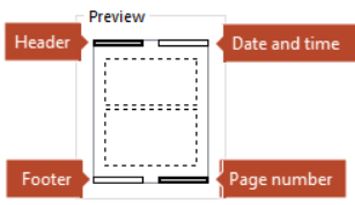 Similar fields are available as the Slide Footer, although the Header text box represents a new option, and only the Apply to All button exists, since the header and/or footer will appear on all pages of the handouts/notes pages. The Header and Footer fields often contain data like company or author names, copyright notices, and keywords like Confidential, Sample, Draft, etc.
To delete any header and footer information from the Notes and Handouts printouts,![]() open the Header & Footer window, click the Notes and Handouts icon, and clear all fields and checkboxes before clicking the Apply to All button.
open the Header & Footer window, click the Notes and Handouts icon, and clear all fields and checkboxes before clicking the Apply to All button.
Apply Design Themes
The most significant way to add visual impact to a PowerPoint presentation is to apply a design theme. A design theme is a named combination of formats that comprise of colors, fonts, backgrounds, and other effects. Themes exist throughout Microsoft Office so that files created in one application tie together with files created in other Office applications. While the default Office theme is plain and boring, users can choose from a gallery of other themes to give the presentation a new look and feel. To change the theme, select a theme from the Themes group on the Design tab. More themes are available by clicking the More button.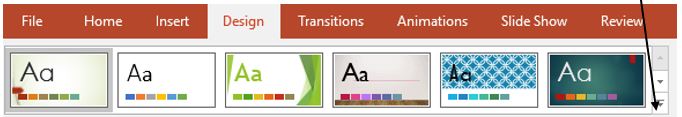
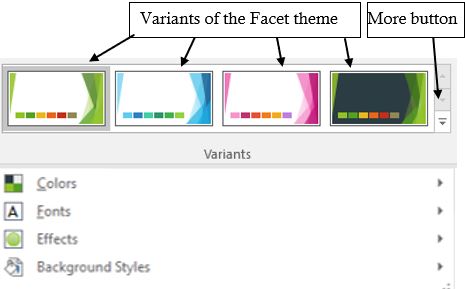
Hover over a theme thumbnail to see the theme name. It’s also easy to quickly change the look and feel of a theme by using variants in PowerPoint. Each theme has its own Variants that apply some predefined color and effect variations. Variants appear to the right of the themes in the Design tab. Variants can be further customized by clicking the More button to modify the theme colors, fonts, effects or background styles. To further customize a design theme, it is easy to apply a new variant while everything else about the theme remains the same.
 Many organizations have a standard, recognizable theme that should be consistently used to follow the organization’s branding standards. While a theme can be applied to individual slides, it is advisable to apply one theme to an entire presentation, which creates a uniform, professional look.
Formatting the Slide Background
While each design theme has its own background colors, patterns or images, every slide in a PowerPoint presentation can modify a background by changing colors, gradient fills, or adding/subtracting graphics. The background is the area behind the text and graphics on a slide. 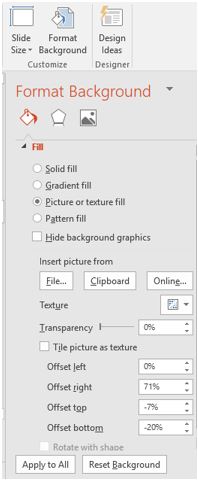
To customize the presentation’s background, click the Format Background button in the Customize group of the Design tab. The Format Background pane will appear to the right of the slide pane. When choosing a different color or gradient fill for the slide background, consider ensuring that a proper contrast between the font colors and the background make the presentation easy to read for your projected audience. A dark background might be appropriate with good lighting, but a dark room might necessitate using a light background color. The Transparency slide bar can mute the color by increasing the transparency percentage. A graphic can be inserted and strategically located to the side of the content placeholder by adjusting the Offset percentages.
After defining all background settings, click the Apply to All button to update all slides with the new background. The slide illustrated below has the Facet theme with a custom background and a graphic offset to appear to the left of the content placeholder.

Replacing Text and Fonts
Popular presentations that get used over extended periods of time often need updating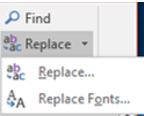 due to product, personnel or company name changes. This is particularly the case in technology companies. Instead of relying on manual editing to find specific words that need to be changed, the Find or the Find & Replace features can be much more accurate to accomplish the same goal. In the Editing group of the Home tab, click the Replace drop-down list, and choose Replace … to
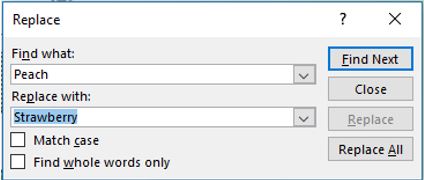 open the Replace window. Use the Find what: and Replace with: fields to update the presentation by replacing certain text with new text. Exact case settings can be required to ensure words like Mark versus mark are not replaced inadvertently.
Sometimes a new design requires that a font be changed throughout the entire presentation. Changing fonts throughout a presentation is very similar to changing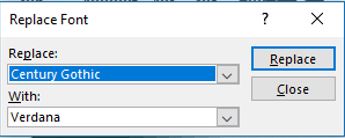 certain text throughout a document or throughout a presentation. In the Editing group of the Home tab, click the Replace drop-down list, and choose Replace Fonts… to open the Replace Font window. In the Replace: drop-down list, choose the existing font that needs to be replaced, and then in the With: drop-down list, select the new font that should appear instead.
Printing a Presentation
A hard copy of a presentation may be printed for a variety of reasons. A copy might be printed to provide an editor to review and edit. A second reason might be to generate speaker notes for the presenter. A third reason might be to produce handouts for audience members. Whichever reason is chosen, previewing the printout in Print ![]() Preview can resolve a lot of unforeseen issues before wasting a lot of time, paper and ink/toner. It is recommended to add the Print Preview icon to the Quick Access Toolbar to make it easy to review the presentation’s accuracy and organization.
Preview can resolve a lot of unforeseen issues before wasting a lot of time, paper and ink/toner. It is recommended to add the Print Preview icon to the Quick Access Toolbar to make it easy to review the presentation’s accuracy and organization.
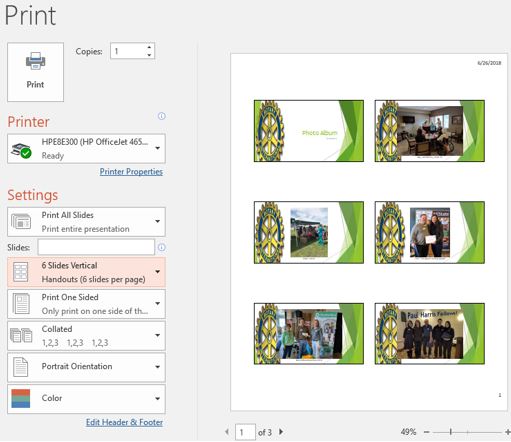
The most common reason to print a PowerPoint file is to produce handouts, but this objective demands further consideration. How will the audience use the handouts? Will they use them as a reference, or will they be used to take notes? The answer to this decision will affect the first option under the Slides setting. The default is Full Page Slides, which is rarely the preferred selection since each slide is printed on its own sheet. Notes Pages should be the option if the intent is to generate speaker notes. The Outline option will print the presentation in outline format which prints text, but no graphics, tables or photos. This option is popular if saving paper is a goal. The nine different Handouts options offer various numbers of thumbnail versions of each slide per sheet of paper. Three slides is appropriate if it is desired to give the audience room to take notes, whereas six slides is suitable if the goal is simply to provide reference materials. Once the print options have been selected, click Print or the Print icon to print the presentation.
Practice 6: The Solar System – Part 5
- Download the Planets.zip file from the Course Data Files. Extract the files to a location on your device where you save files for this course.
- Open a new, blank presentation in PowerPoint.
- Insert a new photo album using the eight photos unzipped from step 1. Choose the 1 picture, Picture layout. Include captions below all pictures.
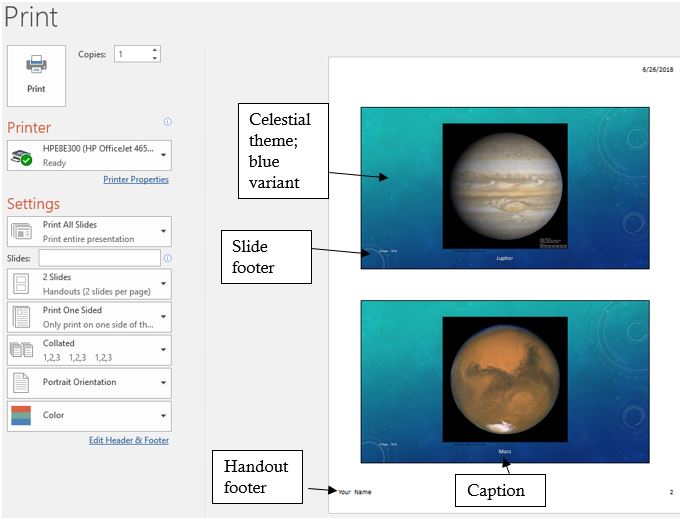
- Apply the Celestial theme, along with the blue variant.
- Change the title text to Our Planets, then change the text to WordArt with the Lime, Accent color 1 Pattern fill.
- Insert a slide footer with M State – 2018 on all slides except the title slide. Include a handout footer with your name.
- Capture a screenshot of Print Preview displaying handouts, 2 Slides per page in full color.
- Compare your results with the screenshot below. Cancel the printing and save the file as Our Planets.pptx.