9 Why is Health Care So Expensive? Market Power and Competition
Caroline Krafft
Updated November 5, 2025
Why does the United States spend so much on health care?
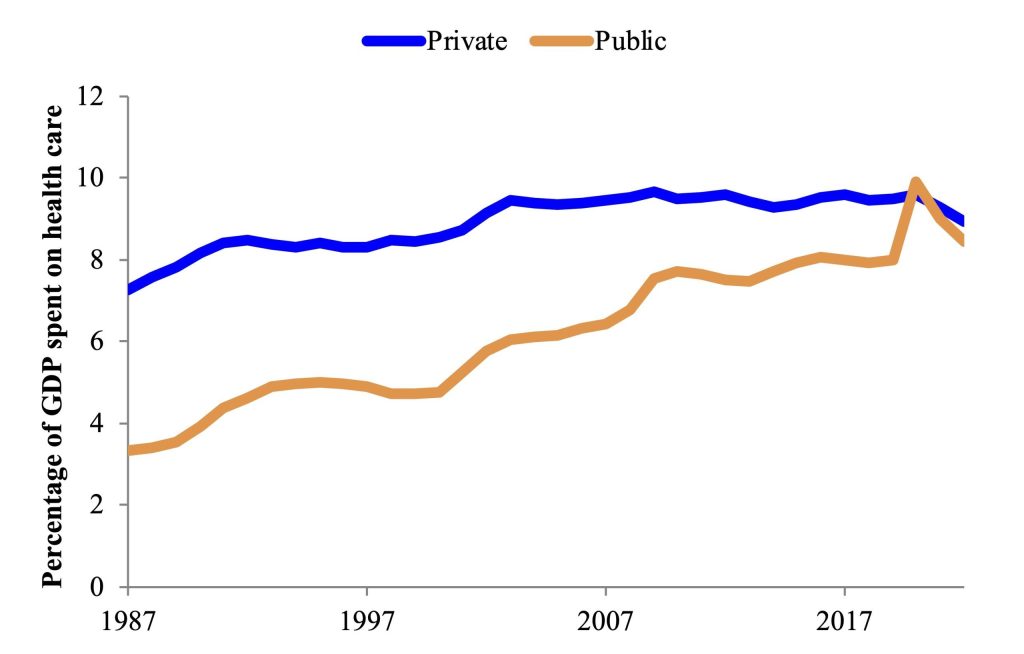
Health care is expensive. Figure 9.1[1] shows health care expenditure in the United States as a percentage of GDP. It also examines the sources of spending, comparing spending from the public sector (the government) and from private sources. Health care is a growing segment of the economy. As of 2023, a total of 18% of GDP went to health care, making it almost one-fifth of the U.S. economy. Around 9% of our economy is private spending on health care and 8% is public spending on health care. This share has been rising substantially; in 1987 private spending on health care was 7% of GDP and public spending on health care was 3%. A number of factors, including improvements in medicine and income, have contributed to this rise. In 2020, the COVID-19 pandemic contributed to the substantial rise in public health care spending particularly.
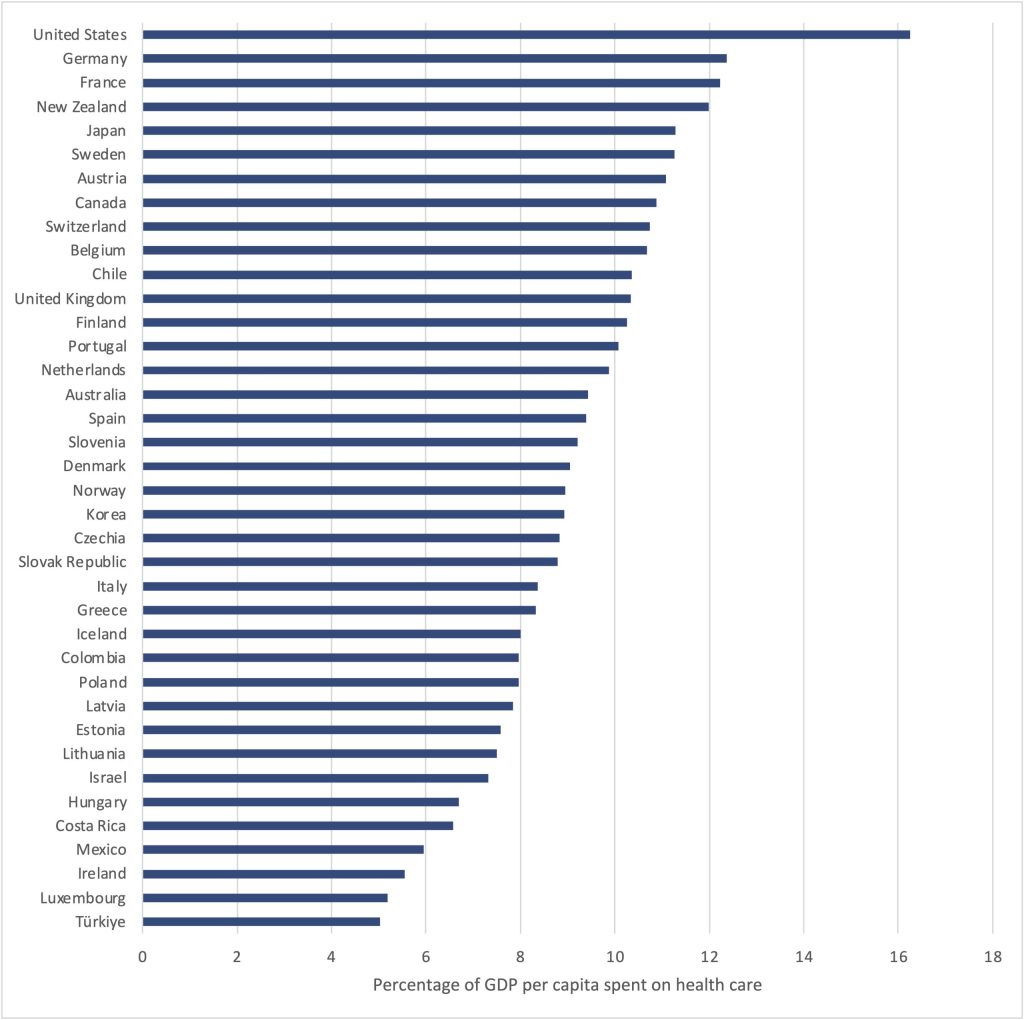
However, the United States is also an outlier in global health spending. While we spent 18% of our GDP on health care as of 2023, comparable countries spent on average only 11% of GDP (Figure 9.2).[2] The next highest spending country, Germany, spent 12% of GDP on health care, and most countries spent less than 10% of GDP on health care. The U.S. spends far more, yet has worse outcomes, in comparison to other countries. When examining 13 developed countries, despite high spending, the United States had the highest infant mortality (deaths) and shortest life expectancy.[3] Why is health care so expensive while outcomes are so poor? This chapter examines some of the drivers of the high costs of health care, with a particular focus on the role of market power.
Non-competitive markets
Market power: Are markets competitive?
Markets tend to work well when they are competitive – when they have many buyers and sellers (and no externalities or other market failures). However, many markets are not competitive, including most health care markets. Market power is when one firm can influence the price of a good or service. Market power is often measured based on the percentage of sales in a market that are sold by one firm (market share). Common measures of market competition are based on market shares. One measure, the concentration ratio is the sum of market shares for the biggest firms, for instance the three-firm concentration ratio is the sum of market shares for the top three firms. The concentration ratio thus focuses on top firms. Another measure, the Herfindahl-Hirschman Index (HHI) is the sum of the squared market shares of all firms. The HHI can range from 0 (highly competitive) to 10,000 (only one firm controls the entire market, a monopoly). In New Jersey, the four-firm concentration ratio for hospital systems was 88% in 2020, meaning that the top four hospital systems controlled 88% of the market.[4] In the U.S., 97% of metropolitan statistical areas (MSAs) have highly concentrated markets[5] for inpatient hospital care (HHIs 1,800 or greater).[6]
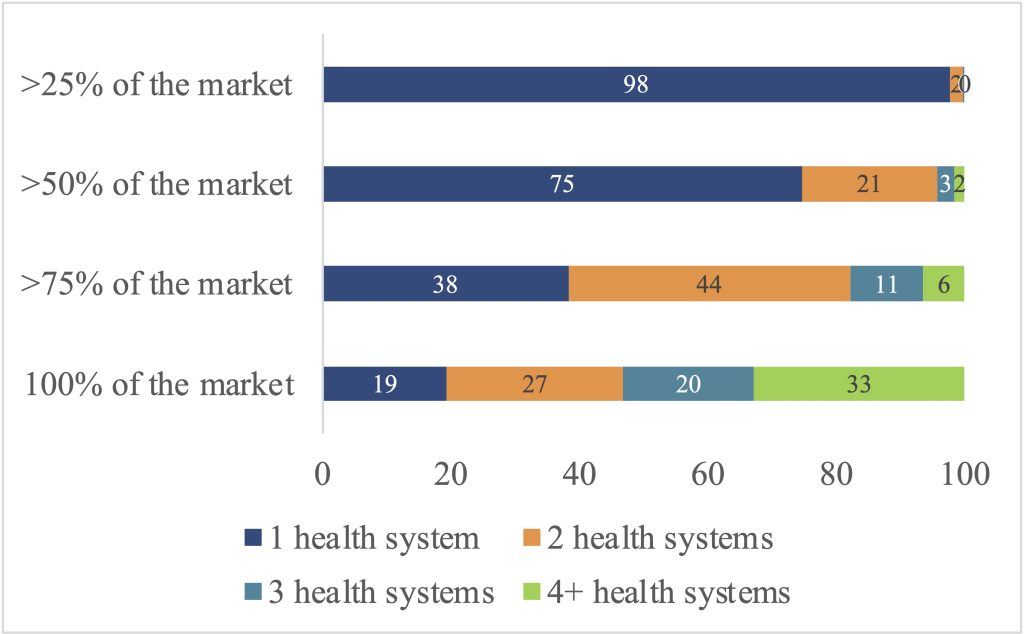
Figure 9.3[7] shows the lack of competition in health care systems in the U.S. It examines what percentage of markets for inpatient hospital care that have one, two, three, or four or more health care systems controlling different shares (25%, 50%, 75%, or 100%) of the market. For instance, one health care system controlled at least 50% of the market in 75% of markets, where markets are measured as MSAs. In 98% of markets, one firm controlled at least 25% of the market. More than 75% of market was controlled by one or two firms in 82% of markets. Two-thirds of markets were completely (100%) controlled by just three firms, and often entirely controlled by two (47%) or even one (19%) of firms. While a monopoly is when only one firm controls a market, an oligopoly occurs when only a few firms control a market – as often is the case with U.S. inpatient hospital care.
Impacts of non-competitive markets
When firms have market power and can affect or set prices, they will make decisions differently than in a competitive market. In general, firms make decisions based on their revenue and their costs. Total revenue is the price times the quantity of the good sold. The marginal revenue is the additional revenue they get for one more of a good being sold. The average revenue is the firm’s total revenue, divided by the quantity. In a competitive market, firms take the price as given and can sell however much they want at that price, so their marginal and average revenue are the same. When a firm has market power, and can influence or set the price, marginal and average revenue are no longer the same. For instance, consider a firm with a monopoly on a new chemotherapy drug (a medicine that treats cancer). They have done market research and know the demand curve. They know that if they want to sell 500 units of the drug, they can charge $1,000, for total revenue of $500,000. If they drop the price to $999, they can then sell 501 units of the drug, for total revenue of $500,499. If you compare the total revenue at 500 units versus 501, you can calculate the difference – the marginal revenue – is $499. The average revenue is the price – $999. This difference between average and marginal revenue is because by lowering the price the firm affects the price of all the units that they sell. Figure 9.4 illustrates a monopolist’s marginal revenue and average revenue for surgeries. The average revenue is the demand curve, but the marginal revenue always falls below the demand curve.
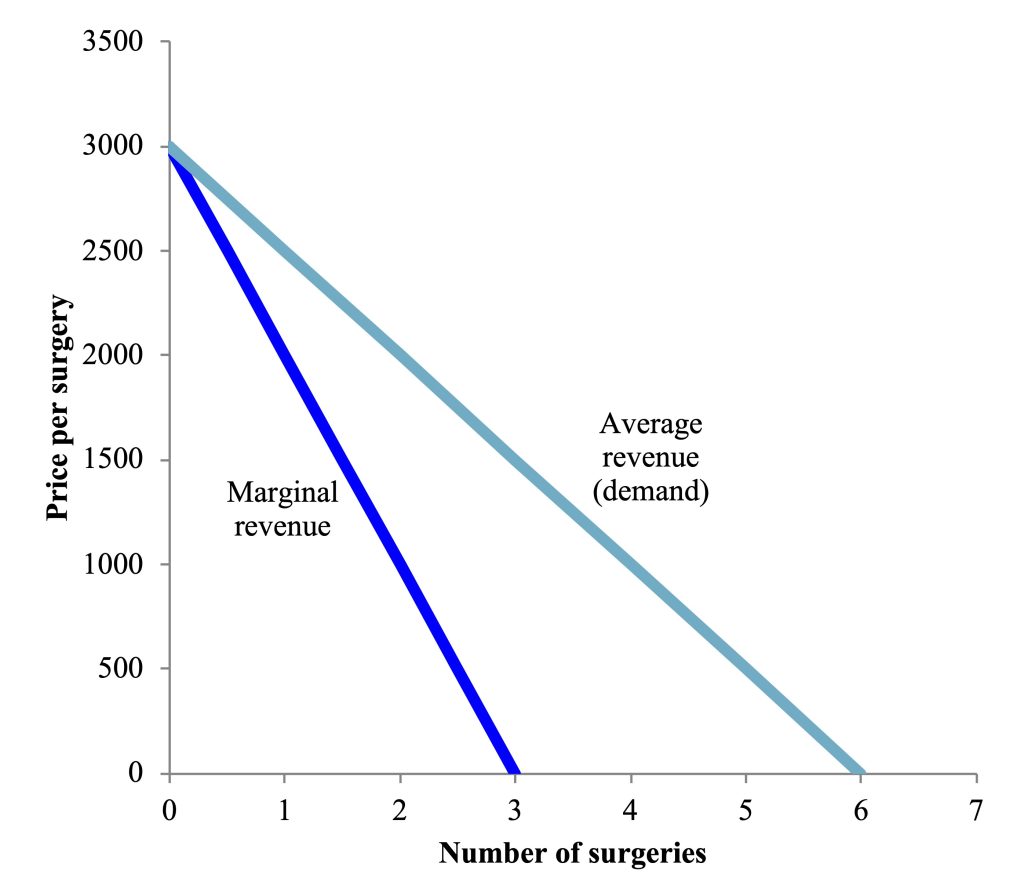
How does a monopolist decide how much to produce? It depends on their costs. There are some fixed costs, which are costs that do not depend on the quantity. For surgeries, a fixed cost would be having an operating room in the hospital. There are also variable costs, which, like marginal costs, depend on the quantity produced. For surgeries, variable costs could be staff time and supplies such as medications or bandages. By adding together fixed costs and variable costs for all units produced, we can calculate total costs. We can also calculate average costs, the average cost per unit produced at a particular quantity. A firm will only produce when its total revenue is greater than or equal to total costs, or likewise when average revenue is greater than or equal to average costs. If revenues are greater than costs, the firm makes a profit. The goal of firms is typically to maximize their profit. For a monopolist, they maximize their profit at the quantity where marginal revenue equal marginal cost. Figure 9.4 shows this in a monopolist market for surgeries. The monopolist then sets their price based on the demand curve. So in the example in the figure, marginal revenue equals marginal cost at a quantity of two surgeries, and from the demand curve, the price is set at $2,000 per surgery. Total revenue is thus $4,000 ($2,000*2). Total costs are only $3,000, so the firm makes a profit of $1,000.
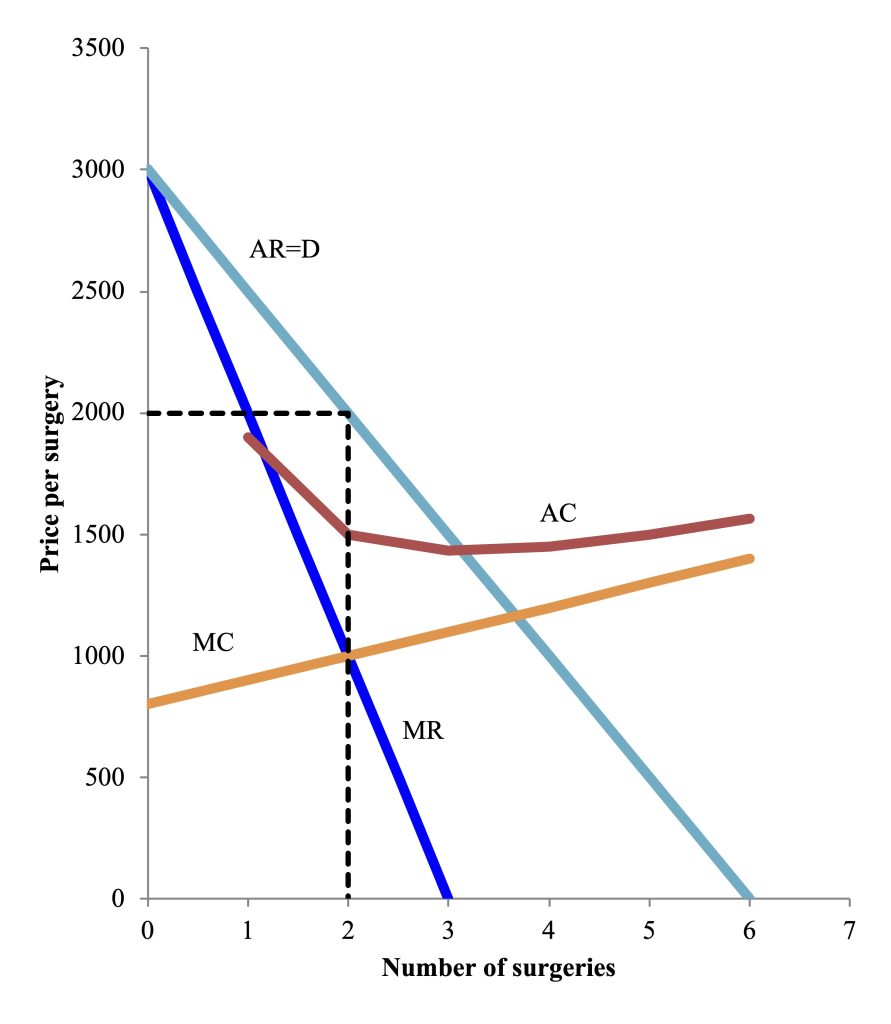
When a market is not competitive, the market outcome (equilibrium), as with an externality, will not be socially optimal. The monopolist has chosen the quantity and price that make their own firm – but not society – best off. In a competitive market, the quantity and price would be where demand meets supply – which is equivalent to where the marginal cost meets the average revenue curve in a competitive case. The price would be lower and the quantity higher than in the monopoly case.
In the market for healthcare, there is substantial evidence that market power raises prices. For instance, prices are 12% higher at monopoly hospitals than those in markets with four or more hospitals.[8] Health insurers in more concentrated markets have higher profits.[9] Likewise, hospitals in highly concentrated markets earn higher profits.[10] More concentrated physician, hospital, and insurer markets lead to higher costs for consumers.[11] Even among simpler medications, 43% of drugs had only a single manufacturer but accounted for 65% of spending.[12]
How do firms obtain market power? Some markets may be particularly prone to market power due to economies of scale – when costs decrease as the scale increases.[13] In the health insurance marketplace, there is some evidence for economies of scale only at small scales, and not past a certain point.[14] There may also be barriers to entry that prevent new firms from easily entering a market. For health care, these barriers can even be regulatory, such as certificate-of-need laws that limit the supply of health care services in the United States.[15] Patents and intellectual property laws, which are designed to encourage innovation, can also create monopolies. Firms can engage in anti-competitive practices that try to block new firms from entering their market.[16]
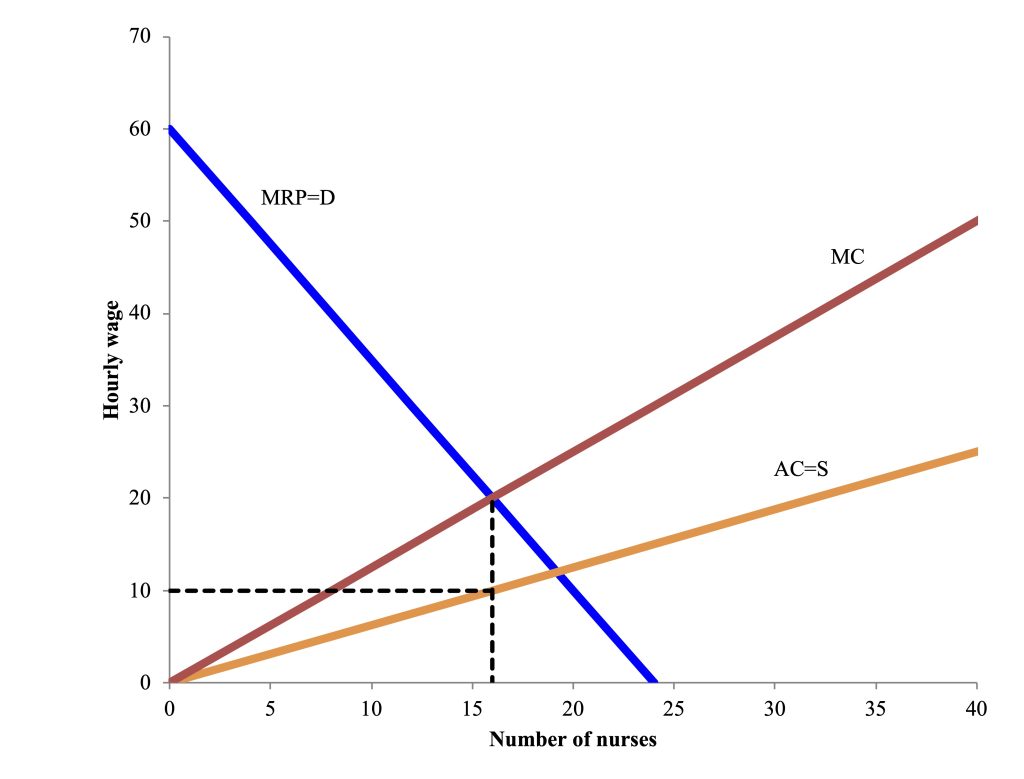
While we have been focused on monopoly, a case with only one supplier, market power can also occur on the buyer side. For instance, when there is only one buyer of a good or service, the market is a monopsony. Consider a monopsony in the health care market – when there is only one local health system, so one buyer of labor for nurses (and likewise for other types of health care workers). They face a supply curve for nurses that will be their average costs. However, if they want to hire one more nurse, they will have to offer a higher wage then they are currently offering – not just to the new hire, but all their other workers (otherwise they would just quit and get rehired!). This means the marginal cost of an additional worker is higher than the average costs, as shown in Figure 9.6.
The health system will optimize where marginal costs are equal to the demand (the marginal revenue product of the nurses). In this example, that is at a quantity of 16 nurses. The firm will pay a wage based on the supply curve at that quantity, in this example $10/hour. This monopsony case can be contrasted with a competitive case, where the social optimum would be found where supply meets demand – at a higher wage and higher quantity of nurses than the monopsonist case. Empirical evidence shows strong monopsony power in labor markets, with fewer workers employed and workers being paid appreciably lower wages as a result of monopsony power.[17]
Policies to address non-competitive markets
Market power leads to market failures – inefficient outcomes that deviate from the social optimum. These failures require government intervention to address. What policies are effective to address non-competitive markets? Preventing market concentration in the first place is one important area for policy. Antitrust laws are designed to prevent businesses from engaging in mergers that create excessive market power, as well as preventing other non-competitive practices. In the United States, the Department of Justice and Federal Trade Commission (FTC) review (and sometimes prevent) mergers and enforce antitrust laws.[18] For example, in Indiana, the FTC opposed a proposed merger of two hospitals, a merger that the FTC argues will raise prices and worsen access to health care services, as well as reduce nurse wages.[19]
An example of recent FTC work to address monopsony power was a regulation to ban most non-compete agreements. These agreements prevent employees, such as physicians and nurses, from switching jobs to work for rival companies.[20] More than a third of U.S. physicians are bound by non-compete agreements.Ending non-competes is estimated to raise worker wages $524 per year, increase patents, increase start-ups, and lower health care costs by $194 billion over a decade.[21] The new rule banning most non-competes was, however, struck down.[22]
Another policy approach in the face of market power is direct market regulation of prices. As you will recall from Chapter 2, price ceilings in a competitive market often are counter-productive, leading to shortages and quality issues. In a non-competitive market, however, price ceilings and other price controls can potentially improve outcomes. The insulin market is one example of how price controls can improve outcomes. Insulin is a medical necessity for diabetics (demand is therefore very inelastic, and there are not substitutes). Despite costs of production that are low and stable between $3 and $6 per vial, prices have increased up to 1200% in recent decades.[23] In January 2023, the U.S. federal government placed a $35 cap on monthly out of pocket costs for insulin through Medicare. A number of states have also implemented price caps between $25-$100. These price caps have not led to shortages, but instead placed pressure on insulin manufacturers to lower prices, as they were making large profits.[24] Similarly, in the U.S., when insurers propose high insurance rate increases, states or the federal government can undertake reviews to assess whether the increases are justified.[25] Removing the profit motive from the health care market is another option, since nonprofit and government health providers behave differently than for-profit ones.[26] Globally, countries other than the U.S. tend to have substantially more public and non-profit and less for-profit components of their healthcare systems, or very heavily regulate and encourage competition in any for-profit sector.[27]
When there is market power on one side (the buyer or seller side of the market), allowing market power on the other side of the market can actually potentially improve outcomes. For example, starting in 2024, Medicare began negotiating drug prices for ten “blockbuster” drugs, generating savings of $7.5 billion.[28] Likewise in labor markets, when there is market concentration on the demand side, unions, which act as one supplier of labor (negotiating on behalf of their workers), can counteract the negative effects of demand-side market power on wages, earning their workers higher wages.[29] For instance, when there are hospital mergers that lead to large increases in market concentration, while typically wage growth slows, strong labor unions counteract this trend.[30]
The role of health insurance
Non-competitive markets are not the only factor contributing to high health care costs. Some researchers point to health insurance itself as contributing to high costs.[31] With health insurance (whether provided by the government or a private insurer), individuals have a complex set of potential costs. Typically, plans have a deductible, a fixed amount that insurance does not cover before paying benefits. For example, you might have to pay the first $1,000 of your health expenses. Insurance often requires cost-sharing as well. People with health insurance who seek medical care may have co-insurance payments, where they have to pay a percentage of costs. For example, individuals may have a co-insurance rate of 20%, where they pay 20% of costs and the insurer pays 80%. Alternatively, individuals may have a co-payment (co-pay) for their visit, a fixed amount, like $20 for an office visit or $250 for an emergency room visit.
Although individuals have to pay for insurance and also have various forms of potential cost-sharing, effectively insurance decreases the price of health care to individuals. It does not, however, decrease the price of health care for insurance companies or society. This disconnect leads to the situation modeled in Figure 9.7, for the case of a co-pay for doctors’ visits. If there were only a private market for doctors’ visits, then supply and demand would determine an equilibrium of five million visits with a price of $100 per visit. However, once there is insurance, the price to the patient drops. The patient now pays only $50 per visit as the co-pay. Now people would choose to have more visits, six million total when the price is $50. The additional visits cost insurance and society. Additionally, the visits become more expensive to society (or the insurance company), at $120 each. Ultimately, patients pay for higher costs through their premiums (if they have private insurance) or through their taxes (if there is government funded insurance).
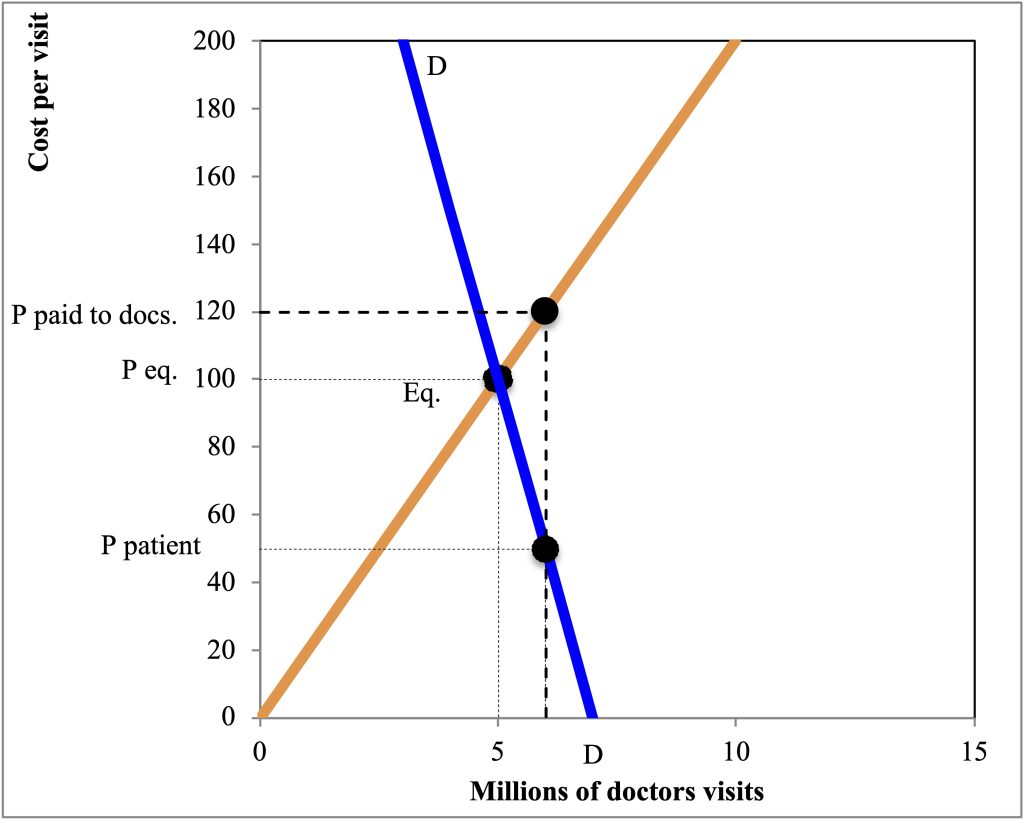
When individuals use more health care because they have insurance, this is a form of moral hazard. Moral hazard occurs when individuals change their behaviors as a result of having health insurance. This may mean that they go to the doctor more.[32] It may also mean that they have less healthy or more risky behaviors because they know if they get sick or injured, they have insurance. Research shows that having insurance reduces healthy behaviors, for example, it increases smoking and drinking and reduces exercise. [33]
If health insurance has all these problematic effects, why do people buy health insurance? Primarily, they want to insure themselves against risk of illness or injury. They also want financial predictability. In the United States, 46% of bankruptcies included medical problems as a factor.[34] That same motivation for insurance, to insure against risk, remains. However, insurance also creates all sorts of distortions in markets. Another substantial issue in insurance markets is referred to as adverse selection. Adverse selection occurs in insurance markets when riskier individuals buy insurance, but less risky individuals do not. For example, someone with an underlying medical condition may buy insurance but someone who is healthy will choose not to buy insurance. If only sick(er) people buy insurance, it becomes extremely expensive.
How we pay doctors may be another contributor to high costs. Commonly, doctors in the United States are paid on a fee-for-service basis. Doctors receive fees for each service they perform. This creates an incentive to do more services—perhaps an extra test or scan. Patients lack the information or expertise to know that these additional services may be unnecessary, leading to unnecessary medical spending. Alternative models than fee-for-spending are also challenging to design but may be more effective.[35] If doctors are paid per patient rather than procedure, they may pick healthier patients. Therefore, building in additional payments for working with patients with chronic health conditions is necessary. This is just one example of the complexities of addressing incentives within the medical system.
Although the United States has substantially increased regulations in health care, costs remain high. Empirically, the United States actually has fewer doctors and hospital visits than other countries, suggesting that higher prices may be a driving factor in our high health care spending, not higher use of health care.[36]
Health insurance policy in the United States
Health care and health insurance are critical issues in the United States. There are a number of reasons we have identified that these markets may not work well on their own. Market failures tend to lead to government intervention. The United States has a substantial government role in health insurance, a regulatory role as well as one in financing and providing healthcare. First, for individuals 65 and older, we have Medicare, a health insurance program for seniors. Medicare, like Social Security, is funded by payroll taxes. Individuals pay in while working and receive benefits at 65. For low-income families, we have Medicaid, health insurance funded by government tax dollars.
Other people may receive their health insurance from private or non-profit insurers. However, there are a number of regulations and government supports for health care. Specifically, in 2010, the U.S. Congress passed the Patient Protection and Affordable Care Act (ACA), often referred to as Obamacare.[37] The ACA mandated that every individual buy insurance (or face a penalty). Frequently people could buy insurance through their employer or received insurance as an employment benefit. However, individuals without employer-provided insurance could, under the new law, shop in newly created state marketplaces for for-profit or non-profit insurance plans. Individuals also received subsidies, if they qualified due to their income, to make insurance more affordable. The law includes a number of other provisions about essential health benefits that must be included in insurance, and addressed other issues as well, such as the share of insurance that may go towards profits versus medical care. Why is health insurance mandated under the ACA? Recall our earlier discussion of adverse selection. Typically, it is sicker people who buy insurance. Requiring everyone to buy insurance helps make sure that there are (currently) healthy individuals with insurance to help spread out the costs of insurance.
Summary and Conclusions
The United States spends far more than other countries on health care – without better health outcomes. Why is health care in the U.S. so expensive? This chapter explored a variety of potential reasons, with a particular focus on market power. The U.S. health care system allows a sizeable role for for-profit firms. When such firms have market power, it increases the costs and reduces the quantity of services they provide. This is one of the many ways that market failures in the health care sector lead to sub-optimal outcomes. The government can, however, take a number of actions to improve outcomes in non-competitive markets, including antitrust actions to foster competition, allowing for market power on both sides of the market, or directly regulating prices. Complex healthcare laws, such as the ACA, are designed to address some of the problems inherent to healthcare markets. Yet costs remain high, suggesting there is scope for further reform of healthcare markets.
List of terms
- Market power
- Market share
- Concentration ratio
- Herfindahl-Hirschman Index (HHI)
- Monopoly
- Oligopoly
- Marginal revenue
- Average revenue
- Total revenue
- Fixed cost
- Average cost
- Total cost
- Profit
- Monopsony
- Antitrust laws
- Deductible
- Co-insurance
- Co-payment (co-pay)
- Moral hazard
- Adverse selection
- Fee-for-service
- Medicare
- Medicaid
- Patient Protection and Affordable Care Act (ACA or Obamacare)
References
Aron-Dine, Aviva, Liran Einav, and Amy Finkelstein. “The RAND Health Insurance Experiment, Three Decades Later.” Journal of Economic Perspectives 27, no. 1 (2013): 197–222. doi:10.1007/978-1-62703-673-3.
Azar, José, and Ioana Marinescu. “Monopsony Power in the Labor Market: From Theory to Policy.” Annual Review of Economics 16, no. 1 (2024): 491–518. doi:10.1146/annurev-economics-072823-030431.
Centers for Medicare & Medicaid Services. “State Effective Rate Review Programs,” 2024. https://www.cms.gov/cciio/resources/fact-sheets-and-faqs/rate_review_fact_sheet.
Cole, Cassandra R, Enya He, and J Bradley Karl. “Market Structure and the Profitability of the U.S. Health Insurance Marketplace: A State-Level Analysis.” Journal of Insurance Regulation 34, no. 4 (2015).
Cooper, Zack, Stuart V. Craig, Martin Gaynor, and John van Reenen. “The Price Ain’t Right? Hospital Prices and Health Spending on the Privately Insured.” Quarterly Journal of Economics, 2019, 51–107. doi:10.1093/qje/qjy020.Advance.
Dafny, Leemore, Mark Duggan, and Subramaniam Ramanarayanan. “Paying a Premium on Your Premium? Consolidation in the US Health Insurance Industry.” American Economic Review 102, no. 2 (2012): 1161–85. doi:10.1257/aer.102.2.1161.
Dave, Dhaval, and Robert Kaestner. “Health Insurance and Ex Ante Moral Hazard: Evidence from Medicare.” International Journal of Health Care Finance and Economics 9, no. 4 (2009): 367–90. doi:10.1007/s10754-009-9056-4.
Gabriel, Elizabeth, and Farah Yousry. “How Will the FTC’s Ban on Noncompete Agreements Impact Doctors and Nurses?” Iowa Public Radio, April 26, 2024.
Given, Ruth S. “Economies of Scale and Scope as an Explanation of Merger and Output Diversification Activities in the Health Maintenance Organization Industry.” Journal of Health Economics 15, no. 6 (1996): 685–713. doi:10.1016/S0167-6296(96)00500-0.
Godwin, Jamie, Zachary Levinson, and Tricia Neuman. “One or Two Health Systems Controlled the Entire Market for Inpatient Hospital Care in Nearly Half of Metropolitan Areas in 2022.” KFF, 2024. https://www.kff.org/health-costs/issue-brief/one-or-two-health-systems-controlled-the-entire-market-for-inpatient-hospital-care-in-nearly-half-of-metropolitan-areas-in-2022/.
Himmelstein, David U., Deborah Thorne, Elizabeth Warren, and Steffie Woolhandler. “Medical Bankruptcy in the United States, 2007: Results of a National Study.” American Journal of Medicine 122, no. 8 (2009): 741–46. doi:10.1016/j.amjmed.2009.04.012.
Horwitz, Jill R. “Making Profits and Providing Care: Comparing Nonprofit, for-Profit, and Government Hospitals.” Health Affairs 24, no. 3 (2005): 790–801. doi:10.1377/hlthaff.24.3.790.
Hsu, Andrea. “Federal Judge Throws out U.S. Ban on Noncompetes.” NPR, August 21, 2024.
Kantarevic, Jasmin, Boris Kralj, and Darrel Weinkauf. “Enhanced Fee-for-Service Model and Physician Productivity: Evidence from Family Health Groups in Ontario.” Journal of Health Economics 30, no. 1 (2011): 99–111. doi:10.1016/j.jhealeco.2010.10.005.
Lu, Rose, Sujoy Chakravarty, Bingxiao Wu, and Joel C. Cantor. “Recent Trends in Hospital Market Concentration and Profitability: The Case of New Jersey.” Journal of Hospital Management and Health Policy 8 (2024): 0–3. doi:10.21037/jhmhp-23-101.
Lupkin, Sydney, and Asma Khalid. “Medicare Negotiated Drug Prices for the First Time. Here’s What It Got.” NPR, August 15, 2024.
Marinescu, Ioana, Ivan Ouss, and Louis Daniel Pape. “Wages, Hires, and Labor Market Concentration.” Journal of Economic Behavior and Organization 184 (2021): 506–605. doi:10.1016/j.jebo.2021.01.033.
McGough, Matthew, Aubrey Winger, Shameek Rakshit, and Krutika Amin. “Peterson-KFF Health System Tracker Health Spending: How Has U.S. Spending on Healthcare Changed over Time?” Peterson-KFF Health System Tracker, 2024. https://www.healthsystemtracker.org/chart-collection/u-s-spending-healthcare-changed-time/.
Mitchell, Matthew D. “Certificate-of-Need Laws in Healthcare: A Comprehensive Review of the Literature.” Southern Economic Journal, 2024, 1–38. doi:10.1002/soej.12698.
Office of the Assistant Secretary for Planning and Evaluation – U.S. Department of Health and Human Services. “Competition in Prescription Drug Markets, 2017-2022,” 2023.
Office of the Legislative Counsel. Compilation of Patient Protection and Affordable Care Act (2010). doi:10.1016/j.jemermed.2007.06.028.
Pifer, Rebecca. “FTC Opposes Indiana’s First Hospital Merger under Controversial COPA Law.” HealthCareDive: Dive Brief, 2024.
Polyakova, Maria, M. Kate Bundorf, Daniel P. Kessler, and Laurence C. Baker. “ACA Marketplace Premiums and Competition Among Hospitals and Physician Practices.” American Journal of Managed Care 24, no. 2 (2018): 85–90.
Prager, Elena, and Matt Schmitt. “Employer Consolidation and Wages: Evidence from Hospitals.” American Economic Review 111, no. 2 (2021): 397–427. doi:10.1257/AER.20190690.
Reid, T.R. The Healing of America: A Global Quest for Better, Cheaper, and Fairer Health Care. Penguin Publishing Group, 2010.
Sokolova, Anna, and Todd Sorensen. “Monopsony in Labor Markets: A Meta-Analysis.” ILR Review 74, no. 1 (2021): 27–55. doi:10.1177/0019793920965562.
Squires, David, and Chloe Anderson. “Issues in International Health Policy: U.S. Health Care from a Global Perspective: Spending, Use of Services, Prices, and Health in 13 Countries.” The Commonwealth Fund 15, no. 1819 (2015): 1–16. doi:10.1146/annurev-publhealth-032013-182411.
Suran, Melissa. “All 3 Major Insulin Manufacturers Are Cutting Their Prices-Here’s What the News Means for Patients With Diabetes.” JAMA 329, no. 16 (2023): 1337–39. doi:10.1001/jama.2022.11688.
U.S. Department of Justice, and Federal Trade Commission. “Merger Guidelines,” 2023.
Wager, Emma, Matthew McGough, Shameek Rakshit, and Cynthia Cox. “How Does Health Spending in the U.S. Compare to Other Countries?” Peterson-KFF Health System Tracker, 2025. https://www.healthsystemtracker.org/chart-collection/health-spending-u-s-compare-countries-2/.
- McGough et al., 2024. ↵
- Wager et al., 2024. ↵
- Squires and Anderson, 2015. ↵
- Lu et al., 2024. ↵
- Per U.S. government merger guidelines (U.S. Department of Justice and Federal Trade Commission, 2023), HHIs of 1,800 or greater are considered highly concentrated. ↵
- Godwin, Levinson, and Neuman, 2024. ↵
- Ibid. ↵
- Cooper et al., 2019. ↵
- Cole, He, and Bradley Karl, 2015. ↵
- Lu et al., 2024. ↵
- Polyakova et al., 2018; Dafny, Duggan, and Ramanarayanan, 2012. ↵
- Office of the Assistant Secretary for Planning and Evaluation - U.S. Department of Health and Human Services, 2023. ↵
- U.S. Department of Justice and Federal Trade Commission, 2023. ↵
- Given, 1996. ↵
- Mitchell, 2024. ↵
- U.S. Department of Justice and Federal Trade Commission, 2023. ↵
- Sokolova and Sorensen, 2021; Marinescu, Ouss, and Pape, 2021. ↵
- U.S. Department of Justice and Federal Trade Commission, 2023. ↵
- Pifer, 2024. ↵
- Gabriel and Yousry, April 26, 2024. ↵
- Ibid. ↵
- Hsu, August 21, 2024. ↵
- Suran, 2023. ↵
- Ibid. ↵
- Centers for Medicare & Medicaid Services, 2024. ↵
- Horwitz, 2005. ↵
- Reid, 2010. ↵
- Lupkin and Khalid, August 15, 2024. ↵
- Azar and Marinescu, 2024. ↵
- Prager and Schmitt, 2021. ↵
- Aron-Dine, Einav, and Finkelstein, 2013. ↵
- Ibid. ↵
- Dave and Kaestner, 2009. ↵
- Himmelstein et al., 2009. ↵
- Kantarevic, Kralj, and Weinkauf, 2011. ↵
- Squires and Anderson, 2015. ↵
- Office of the Legislative Counsel, 2010. ↵

