
3 Trade: An Increasingly Connected World
Caroline Krafft
Where do goods come from?
Set down your reading for a moment and check the labels on your clothes. Where were your clothes made? My sweater was made in China and my shirt was made in the United States. The U.S. textile and apparel industry (including production of clothes in the U.S.) has a value of $65.8 billion as of 2022.[1] However, as looking at your tags will demonstrate, we do not wear only what is produced in the United States. An enormous amount of what we wear we import, meaning it is produced in other countries and we bring it to the U.S. As of 2022, the U.S. imported $153.2 billion dollars of textiles and apparel.[2] Much more clothing is imported to the U.S. than produced in the U.S. (and you probably have more tags with other country names than the U.S.). At the same time as we import textiles and apparel, the U.S. also exports, meaning goods produced here are sold to other countries. As of 2022, we exported $24.5 billion of textiles and apparel.[3] Why are we both exporting and importing? Why do we buy clothes made mostly abroad? What is the impact of all of this trade on the U.S. and other countries?
This chapter examines the state of global trade, including an understanding of why we trade goods and services with other countries. The chapter also examines some of the controversies around trade and its impact on our country and the world. Trade, trade deals, and trade policies are often controversial, as they can have enormous impacts on lives and livelihoods around the world. One concern with trade deals is that we might be “sending our jobs overseas.” Another concern is the environmental and human impact of trade between countries with unequal environmental and human rights protections. Both of these concerns are reflected in the controversy around the Rana Plaza collapse in Bangladesh. Bangladesh’s garment industry is enormous. It employs somewhere between 3.5-4 million people and contributes 12% of Bangladesh’s GDP.[4] In contrast, the U.S. textile and apparel industry employs 0.5 million people.[5] Among the U.S.’s $153.2 billion in clothing imports, $10.2 billion are from Bangladesh.[6]
A number of U.S. and European apparel companies order clothes from Bangladeshi factories. One such factory was Rana Plaza, an eight-story building near Dhaka, Bangladesh. The Rana Plaza garment factory collapsed in 2013, killing over 1,100 workers and injuring thousands more.[7] This collapse, the deadliest disaster to befall the garment industry, was due to poor construction and overloading the building with equipment. The collapse brought attention to the poor and often unsafe conditions garment workers (disproportionately women) face. Would the world be better off without trade? Our economic analysis, below, will ultimately show that, while overall countries gain from trade, there are distinct winners and losers from increasing trade.
Flows of goods
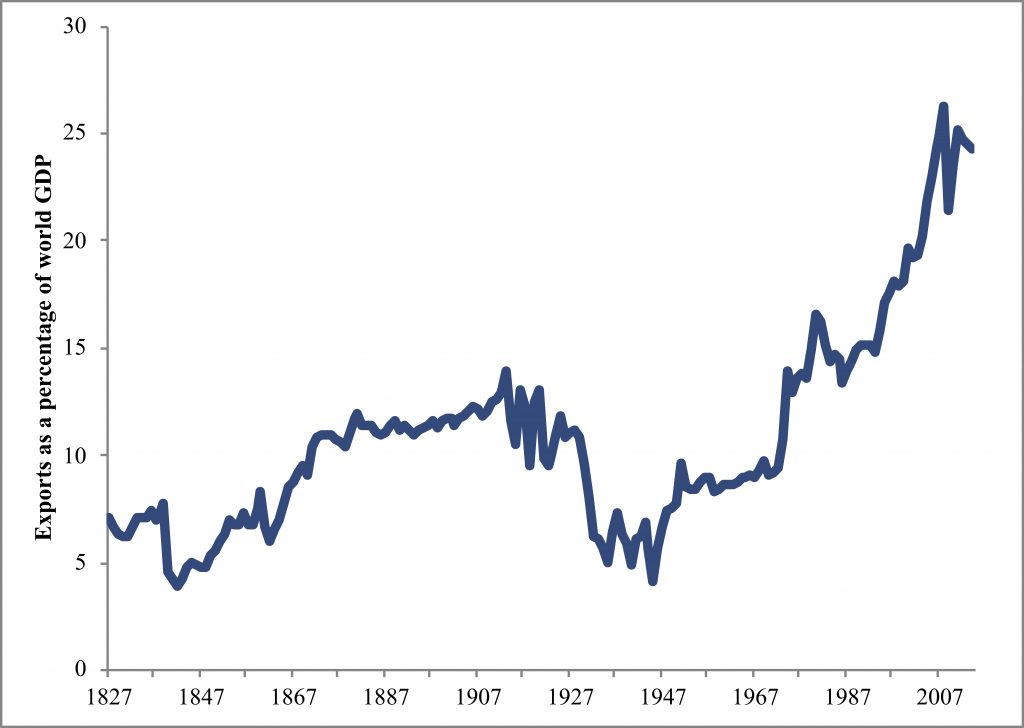
How much do we trade? Figure 3.1[8] shows exports as a percentage of world GDP. Even as early as 1827, exports were substantial (7%) relative to global production. Declining transport costs, particularly maritime transport costs between countries, as well as strong extractive trade links between colonizers and colonies, played an important role in the continuing growth of trade into the 1910s. The decline thereafter was due to rising transport costs (particularly limiting during the world wars), as well as a shift away from using gold as the basis of currency (the gold standard).[9] Trade grew again after World War II, with exports at around 24% of GDP by 2014. Trade is an enormous and increasingly important component of our global economy.
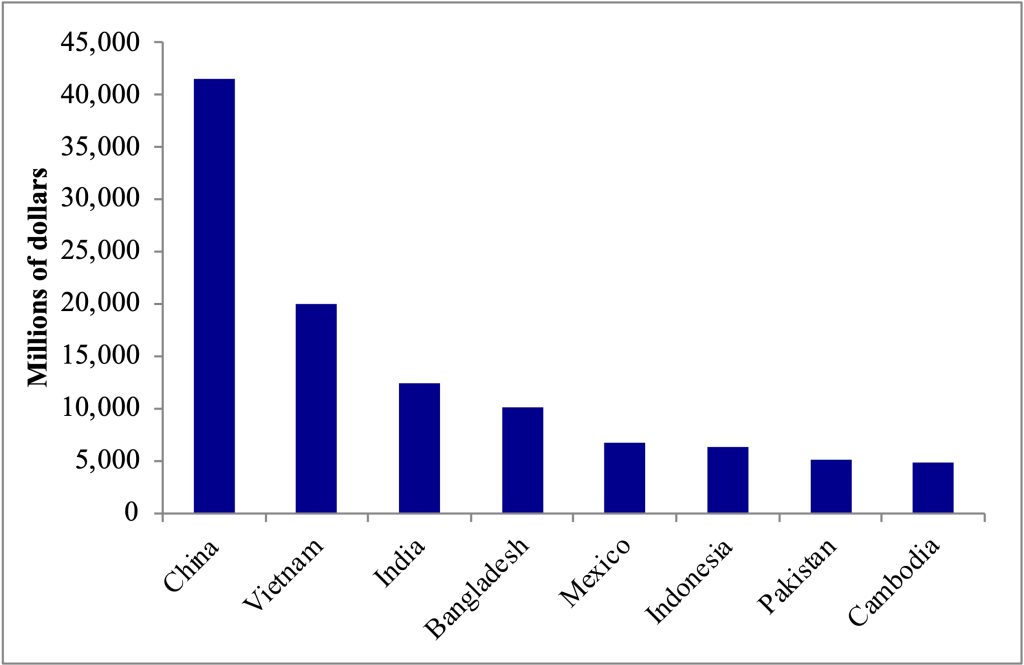
The amount of trade varies across countries and goods. Figure 3.2[10] shows imports to the U.S. from top trading partner countries, for textiles and apparel. The U.S. imports $41.5 billion of textiles and apparel from China alone. It also exports some $0.7 billion in textiles and apparel to China. Geography clearly plays a role in trade as well. The U.S. has both substantial imports ($6.8 billion) from Mexico and substantial exports to Mexico ($4.5 billion).
Comparing the exports and imports data for textiles and apparel, it is clear the U.S. imports more textiles and apparel than it exports. For other goods, such as aircraft, the reverse is true, and the U.S. exports more than it imports. When we add up the value of trade across goods and services to estimate total imports and total exports, we can compare the two to see if we are generally exporting more or importing more. This difference (exports-imports) is referred to as the trade balance.
When exports are greater than imports and the trade balance is positive, there is a trade surplus. When exports are less than imports and the trade balance is negative, there is a trade deficit. Although trade deficits are often highly politicized as a problem (we are buying more than we are producing), there is nothing inherently bad (or good) about either a trade deficit or surplus.[11] When there is a trade deficit, this means other countries are buying less from us than we are from them, but are typically investing that difference in assets, including real estate, debt, or bonds. Essentially, the trade deficit allows us to borrow from foreign countries to invest within our country. Although this borrowing can be a problem if it is unsustainable or excessive, a trade deficit is not inherently a problem.
Figure 3.3[12] shows the trade balances, in billions of dollars, for the five countries with the biggest trade deficits and the five with the biggest surpluses. It also shows these balances as a percentage of GDP, measuring their size relative to countries’ economies. While the U.S. has the largest trade deficit in absolute terms, $862 billion as of 2021, this deficit is only 3.7% of GDP. The U.S. trade deficit is a smaller share of GDP than some other countries with large trade deficits, such as the United Kingdom (a trade deficit of 7.5% of GDP) or the Philippines (a trade deficit of 7.8% of GDP). The largest global trade surplus in absolute terms is for China, $460 billion, 2.5% of its GDP. Germany is the next largest, at $227 billion, which represents 5.7% of its GDP. Although a lot of political concern focuses on these trade surpluses and deficits, countries with strong economies are on both sides of the spectrum of trade balances.
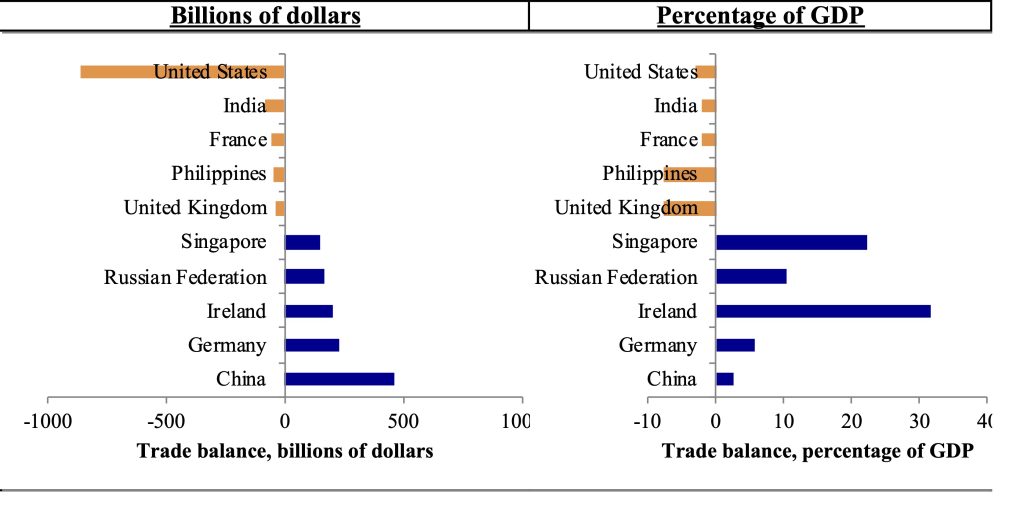
Notes: Five largest (in dollar terms) trade deficits and surpluses.
When countries trade goods, they also have to trade currencies. This trade in currencies is referred to as foreign exchange. The exchange rate is how one country’s currency is translated into another country’s currency. For example, the Bangladeshi currency is the taka. One taka is equivalent to $0.091. It takes 109.74 Bangladeshi taka to buy one U.S. dollar. These exchange rates facilitate trade. For example, if a Bangladeshi company wants to buy a computer from Dell, a U.S. company, and the computer costs $500, the Bangladeshi company can exchange 54,871.20 taka for $500. Likewise, when buying clothes from Bangladeshi manufacturers, a U.S. corporation like Walmart can trade dollars for taka. For a garment costing 800 taka to produce, the U.S. could exchange $7.29. This flow of foreign exchange is how we finance trade.
Why do we trade goods?
Production and consumption
Why do countries trade goods? How do countries decide which goods to make domestically, export, or import? We can answer these questions by returning to our production possibilities frontier model. To make our graphs easier to draw, we’re going to assume the production possibilities frontier is now a straight line (that inputs within a country are not specialized). We are going to ignore currency and prices for the moment and just concentrate on exchanging goods. We’re also going to assume there are only two countries in our model. The intuition of the model will, however, scale up to many countries. As we think about trade, we need to distinguish between production (what countries make) and consumption (what goods or services countries consume). Just like the production possibilities frontier, we can have a consumption possibilities frontier (CPF), the most that people can consume. In Chapter 1, because we were looking only at one country and did not yet consider trade, consumption and production possibilities frontiers were the same.
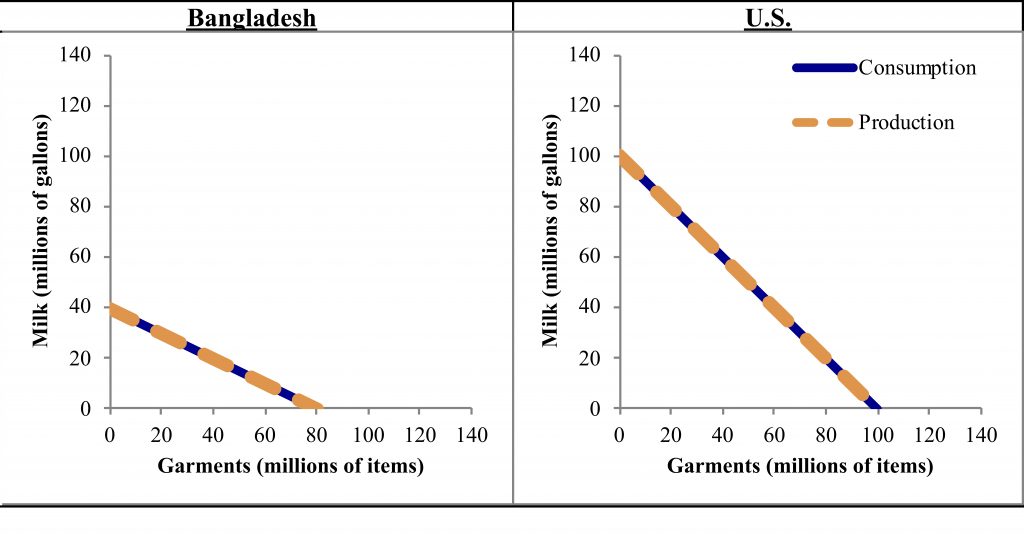
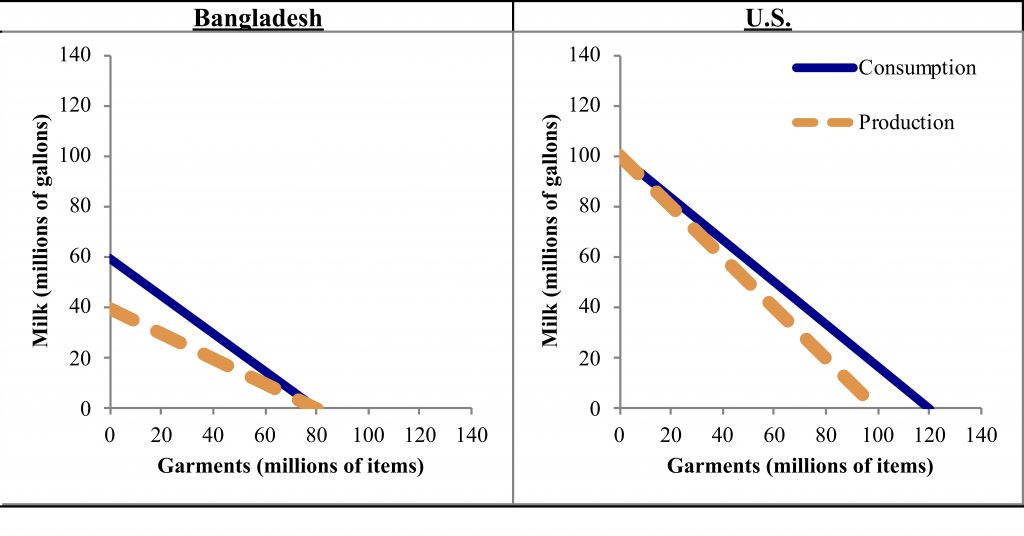
Figure 3.4 shows a case where production and consumption possibilities are the same and there is no trade between Bangladesh and the U.S. In this case our two goods are garments and milk. In this example, the most milk Bangladesh could produce (and consume) would be 40 million gallons (and no garments). The most garments Bangladesh could produce (and consume) would be 80 million items (and no milk). In contrast, the U.S. could produce 100 million gallons of milk or 100 million garments. Both countries could also produce at points in between, with a mix of milk and garments, along the CPF/PPF.
Why do the countries have different production possibilities? Recall what affects production: quantity of labor, quality of labor (human capital), physical capital (including resources) and technology. In the case of milk versus garments, natural resources are critical. Producing milk requires cows eating grass in a field, or fields of hay or corn feeding cows in a barn. There are areas in the U.S. where resources work well for grazing cattle or growing hay or corn. Bangladesh has an ample water supply, which is good for rice, the country’s staple food crop,[13] but not so good for cows grazing, hay, or corn.
When countries trade, they tend to specialize in certain goods to produce and export, and other goods to not produce and import. In the case of Bangladesh and the U.S., Bangladesh tends to specialize in producing garments to export to the U.S. while the U.S. tends to produce and export dairy to Bangladesh.[14] Why do they specialize in these goods and exchange them? The PPF shows that they have different abilities to produce. First off, the U.S. can produce more of both goods, 100 million gallons of milk compared to Bangladesh’s 40 million, and 100 million garments compared to Bangladesh’s 80 million. This ability to produce more, in absolute terms, is referred to as absolute advantage. The U.S. has the absolute advantage over Bangladesh in both milk and garments.
The countries also face different tradeoffs, opportunity costs in changing production. We can see this by comparing the end points of production. If Bangladesh wants to switch from all garments (80 million) to all milk (40 million gallons) it has to give up two garments for every gallon of milk. The opportunity cost of one gallon of milk is two garments. Going the other way, if Bangladesh wanted to shift from all milk to all garments, it would have to give up ½ a gallon of milk for every garment. The opportunity cost of a garment is ½ a gallon of milk. Depending on which way you are looking (increasing milk or increasing garments) this holds for all of the (straight line) production possibilities. Wherever production currently is, the tradeoff is 1 gallon of milk for 2 garments. In contrast, the U.S. can produce either 100 million gallons of milk or 100 million garments. Its tradeoffs are 1:1; it has to give up one garment for one gallon of milk. The opportunity cost of a garment is a gallon of milk (and vice versa). These differences in tradeoffs allow us to identify which country has to give up comparatively more to produce a good.
When a country has to give up relatively less of good A to produce good B, a smaller opportunity cost, it is said to have a comparative advantage. In the example above, Bangladesh had an opportunity cost of ½ gallon milk for every garment while the U.S. had an opportunity cost of 1 gallon of milk for every garment. Bangladesh’s opportunity cost to produce more garments is lower than the U.S.’s. This means that Bangladesh has a comparative advantage in garments. Although one country—like the U.S.—may have an absolute advantage in both products, it can never have a comparative advantage in both. So while Bangladesh has a comparative advantage in garments, the U.S. has a comparative advantage in milk. It only has to give up one garment to produce one more gallon of milk. Bangladesh has to give up two garments to produce one more gallon of milk.
The benefits when two countries trade
Now that we know that Bangladesh has a comparative advantage in garments and the U.S. has a comparative advantage in milk, we can figure out how the countries should specialize their production and then identify the benefits of trade. Countries should specialize in the goods where they have a comparative advantage. Bangladesh should specialize in garments and the U.S. should specialize in milk. The countries then will determine how many garments to exchange for a gallon of milk. This rate of exchange is referred to as the terms of trade. Neither country will accept terms of trade that are worse than what they could do without trade. Thus, the terms of trade must be between 1 and ½ a gallon of milk for a garment. If it had to trade more than 1 gallon of milk for a garment, the U.S. would be better off just producing more garments itself. If it had to trade less than ½ a gallon of milk for a garment, Bangladesh would be better off just producing more milk itself. Where the exchange falls depends on the negotiating skills of the parties involved. Let’s say we end up with an exchange rate of ¾ of a gallon of milk for one garment. The U.S. gives Bangladesh ¾ of a gallon of milk for every garment it sends. Bangladesh gives the U.S. 4/3 of a garment for every gallon of milk it sends. Essentially, 3 gallons of milk go from the U.S. for every 4 garments coming from Bangladesh. The U.S. is importing garments and exporting milk; Bangladesh is importing milk and exporting garments. One country’s export is always another’s import.
Having settled on our terms of trade, although the production possibilities will remain the same, consumption possibilities can change. Since Bangladesh is specializing in garments, still, the most it can get for either production or consumption is 80 million garments. However, if it produces 80 million garments, it can now sell them to the U.S. to get ¾ as many gallons of milk: 60 million gallons of milk. The consumption possibilities for milk have increased from 40 million to 60 million (along with various mixes of garments and milk in between shifting out). At the same time, the U.S. will specialize in milk and thus the most it can consume will still be 100 million gallons. However, if it sells 60 million gallons to Bangladesh it can get 80 million garments in return. So if the U.S. produced 60 million gallons of milk and 40 million garments, it could trade for 80 million garments and end up with 120 million garments (and likewise for various other combinations). The basic idea—shown in Figure 3.5—is that countries are always better of when they trade. Their consumption possibilities always increase, which economists refer to as the gains from trade.
Trade agreements
Now that we know that there are potential gains from trade, we can see why countries often try to make trade agreements, in order to encourage trade. The perspective that trade should be unobstructed and allowed to flow without barriers between countries is referred to as free trade. One recent trade deal is the United States-Canada-Mexico Agreement (USCMA).[15] The deal replaced the North American Free Trade Agreement (NAFTA). The new USCMA has a lot of similarities to NAFTA, but also has a number of new regulations that will create winners and losers. For instance, USCMA requires more U.S. parts in autos, likely resulting in higher auto prices.[16]
Trade agreements are common throughout the world. The European Union (EU) was initially a political union with a common market and easier trade. The EU ultimately worked towards a single integrated market with completely free trade within the EU. Recently, the United Kingdom voted to quit the EU, including leaving the single market.[17] This shift away from free trade was referred to as “Brexit” (British exit). Another recent (and controversial) trade deal is the Trans-Pacific Partnership (TPP). Initially TPP was a deal between the United States, Canada, Australia, and countries in East Asia (including Japan, Malaysia, and Vietnam). The U.S. withdrew under President Trump, with the 11 remaining countries subsequently negotiating a deal without the U.S.[18]
USCMA/NAFTA, the EU, and TPP are all examples of trade deals between a few or a group of countries. Countries may also make bilateral (two-way) deals, between just two countries, such as the U.S. and China. There are some definite tradeoffs to making agreements on a bilateral or regional basis, as they can create an uneven playing field for different countries. The organization that aims to help achieve global free trade, as well as deal with trade disputes between countries, is the World Trade Organization (WTO). WTO agreements (rules of trade) have been signed by the majority of the nations of the globe.[19]
Concerns around free trade
As USCMA/NAFTA, the EU, and TPP illustrate, trade deals are controversial. Part of that is the nature of deals—countries are negotiating to try to get the best deal they can. They may try to renegotiate if deals are no longer working for them or they think they can get a better deal. As well as renegotiating, some countries leave trade deals, as with Brexit. Why might countries want less free trade? A position of wanting less trade is referred to as protectionism. The idea behind the name protectionism is that countries want to protect their domestic production from foreign competition.
We can better understand protectionism if we return to Figure 3.5. Recall that we said that countries are always better off when they trade, because the consumption possibilities increase. While countries as a whole are better off, trade and trade deals create winners and losers. In the example of the U.S. and Bangladesh, think of what happens when we go from Figure 3.4, with no trade, to Figure 3.5, with trade. Perhaps in the no trade case Bangladesh chose to produce 20 million gallons of milk and 40 million garments. When it trades, it specializes in garments, produces zero gallons of milk, and 80 million garments. Perhaps it trades 32 million garments for 24 million gallons of milk.
Consumers are better off. They are left with 48 million garments (more than 40 million without trade) and now have 24 million gallons of milk (more than 20 million without trade). However, there are winners and losers among producers in Bangladesh. Bangladeshi garment producers win—their business rapidly expands. Bangladeshi milk producers lose—their farms shut down. The loss or shrinking of certain industries due to trade motivates protectionism in Bangladesh. Likewise, in the U.S., consumers win as a result of trade, but garment producers lose and milk producers win. In Bangladesh, the milk producers would protest a trade deal, while in the U.S., garment producers would protest. Empirically, there are distinct winners and losers when trade increases. In Brazil, increased trade likely reduced poverty overall, but with effects that varied by state and rural versus urban areas.[20]
Trade restrictions can take a variety of different forms, as we will discuss below. Globally, when trade restrictions, such as the Multifiber Arrangement, are lifted countries receive differential benefits.[21] Lifting trade restrictions can reduce the prices of goods for consumers. Ending the Multifiber Arrangement in 2005 led to a decrease in costs averaging $63 per household.[22] This impact highlights an important and challenging aspect of trade deals. The benefits tend to be large in total but diffuse (every American having slightly cheaper clothes) while the costs are less in total, but concentrated (U.S. cities where garment factories were shut down were strongly affected, with some people losing jobs). Although there are additional gains in other sectors (in Figure 3.5, the U.S. dairy sector would be hiring), these jobs are not necessarily in the same locations, nor do they require the same skills, which is why trade agreements also often include provisions for retraining of workers.
Other protectionist arguments have to do with safety. Countries may want to ensure they have domestic production of certain goods and services. For instance, countries may want a certain amount of domestic military or food production, so that in the event of a global disaster or war they can protect their populace. There may also be concerns about the quality or safety of imported products. Another safety issue is the “race to the bottom” illustrated by the Rana Plaza tragedy in Bangladesh. One of the reasons firms may choose to produce in Bangladesh is that it is cheaper to do so. This cheaper production may be because safety conditions and human rights protections are not observed. Likewise, production may move to locations where there are not environmental protections. Environmental protections are costly, and it is cheaper to produce in ways that damage the environment (a point we will return to in later chapters).
Although worker safety, human rights, and the environmental impact of trade are serious concerns, it is not clear to what extent trade is impacting these areas; there is ongoing debate among economists.[23] It may also be possible to build protections, for instance environmental standards, into trade deals.[24] Consumers may be willing to pay more for goods which are ethically produced, for example, fair trade coffee which more directly benefits farmers and their families.[25]
Trade restrictions
If countries decide to go the protectionist route, how might they reduce or prevent trade? There are three main policy options. The first, most radical, and simplest, is an embargo, forbidding any trade at all (or any trade in certain goods). Putting in place an embargo essentially takes a country allowing trade, with the CPF exceeding the PPF (Figure 3.5), and returns it to the CPF equaling the PPF (Figure 3.4). The countries can only consume what they produce. There is a clear loss to consumers. The other common types of trade restrictions are quotas, which are maximum quantities allowed in, and tariffs, which are a tax on imports. In order to understand the impact of quotas and tariffs on the economy, we will return to our supply and demand model.
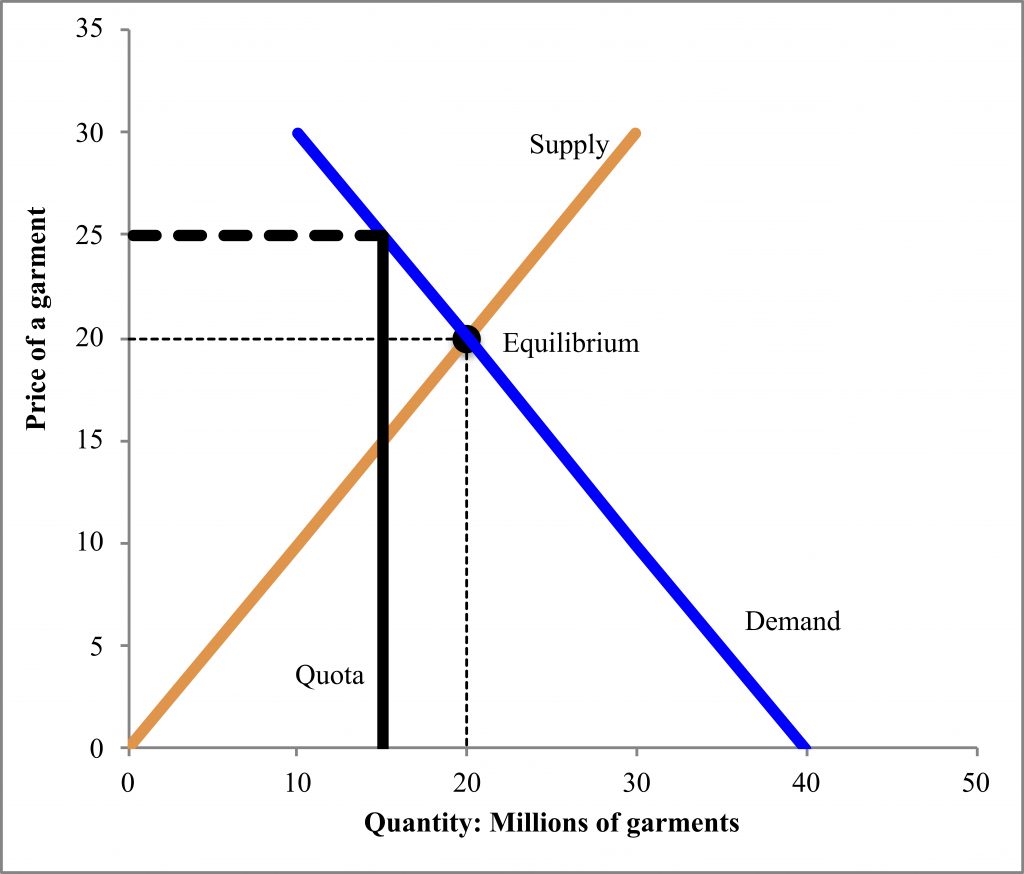
Figure 3.6 shows the U.S. market for garments from Bangladesh. If there are no trade restrictions, that means our usual supply and demand analysis applies, and equilibrium is a price of $20 and 20 million garments. However, we can add a quota to the market. Here, we set a quota at a maximum of 15 million garments. Similar to the case with price controls, there are times when the quota may have no effect. If the quota (maximum quantity) is 30 million, in this market, it will have no effect. However, with a quota of 15 million Bangladeshi garments, the quantity definitely goes down in this market. At a quantity of 15 million, the price can be found on the demand curve (since that’s how much people are willing to pay). The price is $25. Suppliers would be foolish to lower the price to try to move to equilibrium, because if they lower the price, the quantity cannot increase, and they will just be making less money. As a result of the quota, consumers face higher prices. Suppliers in Bangladesh who succeed in exporting their goods to the U.S. with the quota receive a higher price, but many suppliers in Bangladesh cannot export. We can actually do a bit of math to determine that at $20 with 20 million garments Bangladeshi suppliers would get $400 million, and at $25 with 15 million garments, suppliers would get only $375 million, a net loss. Consumers in the U.S. are losing, suppliers in Bangladesh are losing. So, who is winning?
The winner is someone not on the graph: U.S. garment producers. Since a bunch of folks in the U.S. are no longer buying clothes from Bangladesh, this will lead to an increase in demand in the U.S. garment market. This increase in demand will also increase prices for consumers. Ultimately, economists have shown that the gains to producers are less than the losses to consumers, and so a quota causes a net loss to the U.S. economy (as well as a loss to Bangladesh).
What happens if, rather than a quota, we use a tariff (tax on imports)? Figure 3.7 shows a $10 tariff on garments from Bangladesh. We show the tariff as a decrease in supply, raising prices exactly $10 along the whole supply curve. This shift is essentially an increase in the cost of production to get the garment into the U.S. It’s easiest to see the tax where supply hits the price axis; there we can see the difference between the original supply and supply with tax is $10. We find the new equilibrium for consumers where supply with tax meets demand. The price (labeled Pd) is $25 and quantity 15 million. This price and quantity are the same results we got with a 15 million quota. However, the difference in this case is that firms in Bangladesh do not receive the full higher price. Instead, they receive the price less the tariff: $25-$10=$15 (labeled Ps).
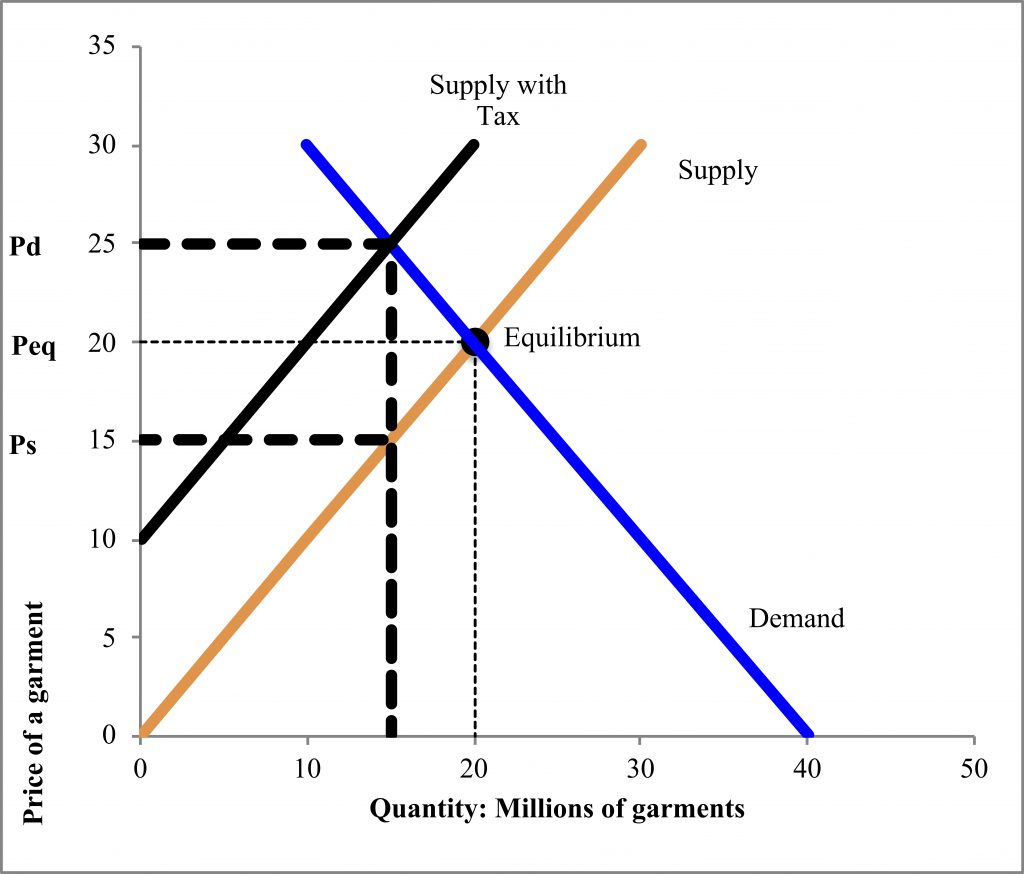
Bangladeshi producers are, in this case, all worse off, as are consumers in the U.S. Producers in the U.S. have increased demand for U.S. clothes, but consumers will face higher prices for those as well. There is another winner in this case as well—the government. The government receives the tariff as revenue. Specifically, in this example, it receives $10 for each of 15 million garments: $150 million. However, economic analysis can demonstrate that the benefits to the winners (U.S. producers and government) are less than the harms (increased prices) to consumers. As with quotas, tariffs create a net loss. For example, from the 2018 U.S. tariffs against washing machines, washing machine prices rose almost 12%.[26] Consumers paid more than 100% of the costs of the tariff increase, because firms increased dryer prices at the same time, even though they did not face tariffs. The tariffs did create additional jobs in domestic washing machine manufacturing – but at a very high cost to consumers of $820,000 per job created.[27]
Summary and Conclusions
We live in a globalizing world. Trade has become increasingly important in the global economy. Trade can definitely increase the consumption possibilities for consumers. However, it creates distinct winners and losers among producers, which is one of the reasons that protectionists argue against free trade. Protectionist measures include embargoes, quotas, and tariffs. Our economic analysis demonstrated that all these measures cause specific winners and losers. Consumers lose due to higher prices, but domestic (protected) producers win. However, the country placing trade restrictions, on the net, loses. Additionally, when countries such as the U.S. start to place restrictions on trade, their trading partners are likely to undertake a tit-for-tat retaliation strategy, raising trade restrictions on U.S. goods and harming (different) U.S. producers. Currently, the U.S. is engaged in a trade war with China; China has retaliated with tariffs that are hurting U.S. exporters, whether Minnesota farmers exporting soybeans or Massachusetts cranberry producers.[28]
Trade deals are one tool to try to address some of the concerns around trade through a package of measures; countries can ensure they each have winning industries. Trade deals can also, potentially, allow for including human rights and environmental protections. Such protections help avoid a “race to the bottom” in production. Deals can also include funds for retraining or relocating displaced workers in order to ensure shifts in production do not lead to large increases in unemployment in certain sectors or locations.
List of terms
- Import
- Export
- Trade balance
- Trade surplus
- Trade deficit
- Foreign exchange (rate)
- Consumption possibilities curve
- Absolute advantage
- Comparative advantage
- Terms of trade
- Gains from trade
- North American Free Trade Agreement (NAFTA)
- United States-Canada-Mexico Agreement (USCMA)
- European Union (EU)
- Trans-Pacific Partnership (TPP)
- World Trade Organization (WTO)
- Protectionism
- Free trade
- Embargo
- Quota
- Tariff
References
Castilho, Marta, Marta Menéndez, and Aude Sztulman. “Trade Liberalization, Inequality, and Poverty in Brazilian States.” World Development 40, no. 4 (2012): 821–35. doi:10.1016/j.worlddev.2011.09.018.
Estevadeordal, Antoni, Brian Frantz, and Alan M. Taylor. “The Rise and Fall of World Trade, 1870-1939” 118, no. 2 (2017): 359–407.
FAO. “GIEWS – Global Information and Early Warning System,” 2017. http://www.fao.org/giews/countrybrief/country.jsp?code=BGD.
Flaaen, Aaron, Ali Hortacsu, and Felix Tintelnot. “The Production, Relocation, and Price Effects of US Trade Policy: The Case of Washing Machines.” Becker Friedman Institute Working Paper. Chicago, IL, 2019. doi:10.2139/ssrn.3374918.
Frankel, Jeffrey A., and Andrew K. Rose. “Is Trade Good or Bad for the Environment? Sorting out the Causality.” The Review of Economics and Statistics 87, no. 1 (2005): 85–91.
Godden, Maryse. “What Is the EU Single Market and Will the UK Quit after Brexit?” The Sun, August 16, 2017.
Harrigan, James, and Geoffrey Barrows. “Testing the Theory of Trade Policy: Evidence from the Abrupt End of the Multifiber Arrangement.” The Review of Economcis and Statistics 91, no. 2 (2009): 282–94.
International Monetary Fund. “2019 External Sector Report: The Dynamics of External Adjustment.” Washington, DC: International Monetary Fund, 2019.
Lovely, Mary E., and Jeffrey J. Schott. “The USCMA: New, Modestly Improved, but Still Costly.” Peterson Institute for International Economics Trade and Investment Policy Watch, 2019. https://www.piie.com/blogs/trade-and-investment-policy-watch/usmca-new-modestly-improved-still-costly.
Ma, Adrian. “How the Trade War Crushed a Growing Chinese Market for U . S . Cranberries.” MPRnews, 2019. https://www.mprnews.org/story/2019/10/06/npr-how-the-trade-war-crushed-a-growing-chinese-market-for-u-s-cranberries.
Managi, Shunsuke, Akira Hibiki, and Tetsuya Tsurumi. “Does Trade Openness Improve Environmental Quality?” Journal of Environmental Economics and Management 58, no. 3 (2009): 346–63. doi:10.1016/j.jeem.2009.04.008.
Mayer, Amy. “Collateral Damage of the Trade War, Farmers Want Chinese Market Reopened.” MPRnews, 2019. https://www.mprnews.org/story/2019/05/22/npr-collateral-damage-of-trade-war-farmers-want-chinese-market-reopened.
National Council of Textile Organizations. “U.S. Textile Industry: Facts and Figures,” 2023. http://www.ncto.org/facts-figures/us-textile-industry/.
Ortiz-Ospina, Esteban, Diana Beltekian, and Max Roser. “Trade and Globalization.” Our World in Data, 2019. https://ourworldindata.org/trade-and-globalization.
Prakash, Aseem, and Matthew Potoski. “Racing to the Bottom? Trade, Environtmental Governance, and ISO 14001.” American Journal of Political Science 50, no. 2 (2006): 350–64.
Rotaris, Lucia, and Romeo Danielis. “Willingness to Pay for Fair Trade Coffee: A Conjoint Analysis Experiment with Italian Consumers.” Journal of Agricultural and Food Industrial Organization 9, no. 1 (2011). doi:10.2202/1542-0485.1305.
Swick, Brenda C., and Dylan E. Augruso. “Canada Reaches Comprehensive and Progressive Trans-Paci c Partnership Agreement.” The National Law Review, January 29, 2018.
Trella, Irene, and John Whalley. “Global Effects of Developed Country Trade Restrictions on Textiles and Apparel.” The Economic Journal 100, no. 403 (1990): 1190–1205.
United States International Trade Commission. “U.S. Trade by Industry Sectors and Selected Trading Partners,” 2023. https://www.usitc.gov/research_and_analysis/tradeshifts/2022/us_trade_industry_sectors_and_selected_trading.
U.S. Department of State Bureau of South and Central Asian Affairs. “U.S. Relations with Bangladesh.” U.S. Department of State Diplomacy in Action, 2016. https://www.state.gov/r/pa/ei/bgn/3452.htm.
Westerman, Ashley. “4 Years After Rana Plaza Tragedy, What’s Changed For Bangladeshi Garment Workers?” NPR, 2017. http://www.npr.org/sections/parallels/2017/04/30/525858799/4-years-after-rana-plaza-tragedy-whats-changed-for-bangladeshi-garment-workers.
World Bank. “World Development Indicators.” World Bank Databank, 2023.
World Trade Organization. “WTO Members and Observers,” 2019. https://www.wto.org/english/thewto_e/whatis_e/tif_e/org6_e.htm.
- National Council of Textile Organizations, 2023. ↵
- United States International Trade Commission, 2023. ↵
- Ibid. ↵
- Westerman, 2017. ↵
- National Council of Textile Organizations, 2023. ↵
- United States International Trade Commission, 2023. ↵
- Westerman, 2017. ↵
- Ortiz-Ospina, Beltekian, and Roser, 2019. ↵
- Estevadeordal, Frantz, and Taylor, 2017. ↵
- United States International Trade Commission, 2023. ↵
- International Monetary Fund, 2019. ↵
- World Bank 2023. ↵
- FAO, 2017. ↵
- U.S. Department of State Bureau of South and Central Asian Affairs, 2016. ↵
- Lovely and Schott, 2019. ↵
- Ibid. ↵
- Godden, August 16, 2017. ↵
- Swick and Augruso, January 29, 2018. ↵
- World Trade Organization, 2019. ↵
- Castilho, Menéndez, and Sztulman, 2012. ↵
- Trella and Whalley, 1990. ↵
- Harrigan and Barrows, 2009. ↵
- See, for example, the contrasting claims in Managi, Hibiki, and Tsurumi, 2009; Frankel and Rose, 2005. ↵
- Prakash and Potoski, 2006. ↵
- Rotaris and Danielis, 2011. ↵
- Flaaen, Hortacsu, and Tintelnot, 2019. ↵
- Ibid. ↵
- Mayer, 2019; Ma, 2019. ↵
