
2 Supply and Demand: Who gets food, housing, and work?
Caroline Krafft
Who gets food? The role of markets
Yemen’s food insecurity is an enormous challenge to the wellbeing of Yemenis. In the last chapter, we examined issues of production and ownership of production in thinking about why so many Yemenis were going hungry and what we can do to solve hunger. In this chapter we will focus on how food is allocated within Yemen through markets. The World Food Program (WFP) goes to markets in different areas of Yemen to check on the prices of different foods in local marketplaces. Unaffordable food prices in local markets are an important part of the story of food insecurity in Yemen[1]—and the U.S.[2] In this chapter, first we will learn about the role of markets, including supply and demand. We will then turn to the forces that can shift supply and demand to think about how to make food more affordable. Finally, we will analyze the effect of price controls on markets, focusing on two specific topics: rent control in the housing market, and minimum wages in the labor market.
Demand: What people want
How much food do families want? The answer to this question is going to depend on a number of different factors that we will explore throughout the chapter, but we will start with the price of food. The price is what a buyer pays (and what a seller receives) for a good or service. In Yemen, the currency is the Yemeni rial, so the prices are, for example, 100 rials for a pound of wheat flour. How many pounds of flour a family wants will depend on this price. The relationship between the price and the quantity people want is called demand. It is possible to describe this relationship with a table, an equation, or a graph. In this book, we will focus on graphing demand.
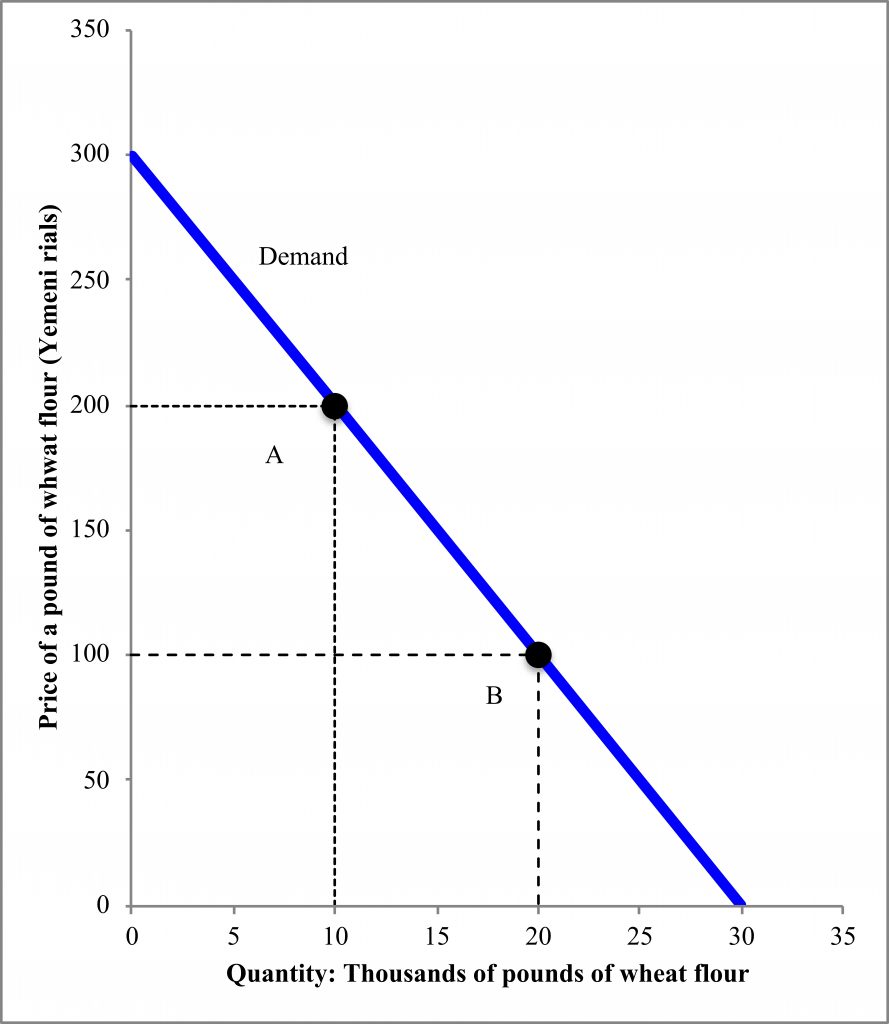
Figure 2.1[3] shows the demand for wheat flour in Amran governorate (a governorate is like a state) in Yemen. On the x-axis (the horizontal axis) is the quantity, measured as thousands of pounds of wheat flour. On the y-axis (the vertical axis) is the price of a pound of flour, in Yemeni rials. The amount people want at a particular price is called the quantity demanded. At a price of 200 rials, the quantity demanded is 10,000 pounds (point A). At point B, when the price is 100 rials, the quantity demanded is 20,000 pounds of wheat flour. If the price rises to 200 rials, families will demand fewer pounds of flour. If the price drops even further, to 50 rials, they will demand more pounds of flour. This pattern occurs for a variety of goods: when the price goes down, people demand more. Likewise, if the price goes up, people demand less. This relationship is sometimes referred to as the “law of demand,” like the law of gravity. Graphically, this relationship is the downward slope of demand. Note that the whole curve is referred to as demand, while a particular point (such as point A) shows a price and quantity demanded.
Supply: What people can provide
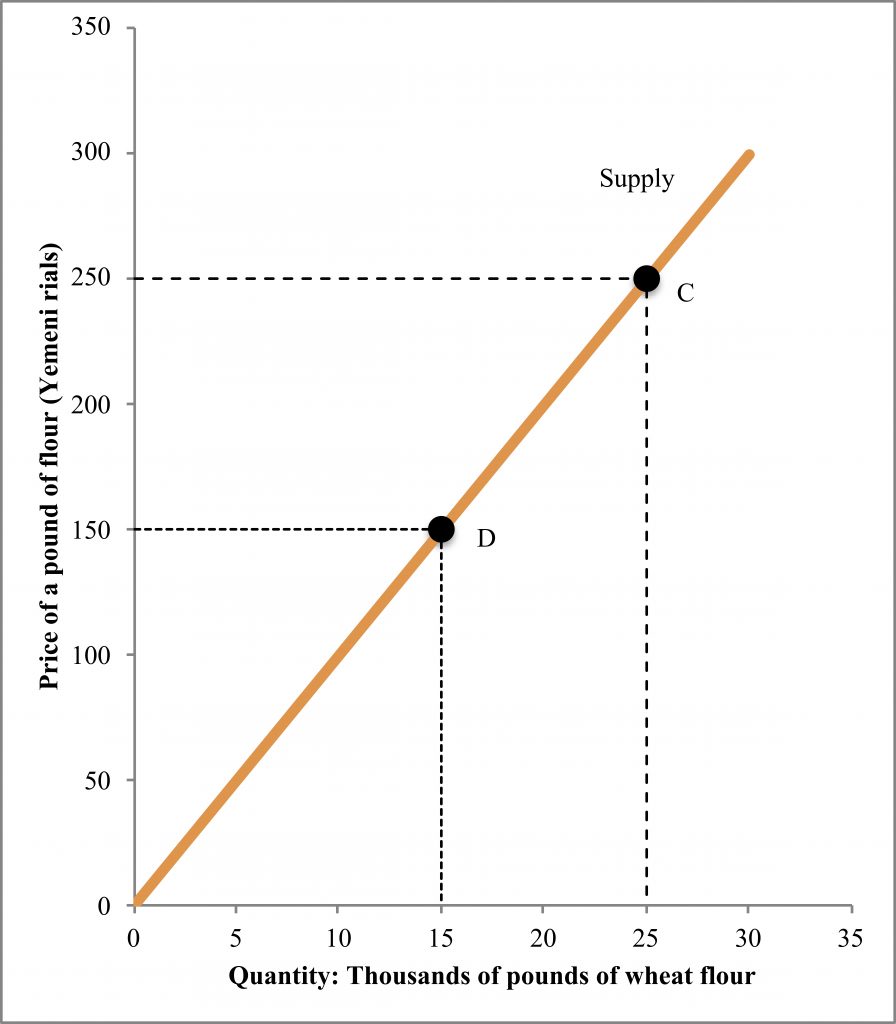
Demand is just one side of the story of how much food (or hunger) there is. The other side is supply: how much people or firms are willing to produce and provide to buyers. Like demand, supply depends on price and can be presented as a table, equation, or graph. The amount people want to provide at a particular price is called the quantity supplied. Figure 2.2 shows the supply of wheat flour in Amran governorate. At point C, when the price is 250 rials, the quantity supplied is 25,000 pounds. Point D shows that, at a price of 150 rials, the quantity supplied is 15,000 pounds. Suppliers want to supply less as the price decreases, and they want to supply more as the price increases. This relationship is often referred to as the “law of supply.”
When you are first learning supply and demand, it may be tricky to keep track of what the graph should look like. Here are some tricks to help:
- Demand is Downward sloping (both down and demand start with D)
- Supply is upward sloping (both supply and up have an “up”)
- The axes are labeled alphabetically: p goes before q in the alphabet, so when you are drawing your graph, starting at the upper left (just like writing) you’ll label price first on the y-axis (vertical axis) and q second on the x-axis (horizontal axis)
Markets and equilibrium: Exchanges of goods and services
Supply and demand for a particular good or service—such as wheat flour in Amran governorate—are two sides of a market. Simply put, a market is where supply and demand come together. Sometimes “where” is a physical place, like the vegetable market (souq) in Amran city. Other times “where” is more of a concept. For example, the market for social media apps takes place on the internet.
Together supply and demand determine the price and quantity of a good. In Figure 2.3, supply and demand for wheat flour are shown on the same graph. Where supply and demand meet (cross or intersect) is referred to as equilibrium. In equilibrium, the price is 150 rials and the quantity is 15,000 pounds of flour. At this price, the quantity supplied and quantity demanded are equal. Unless something else changes in the economy to shift the curves (a possibility we will turn to next), price and quantity at equilibrium will stay the same.
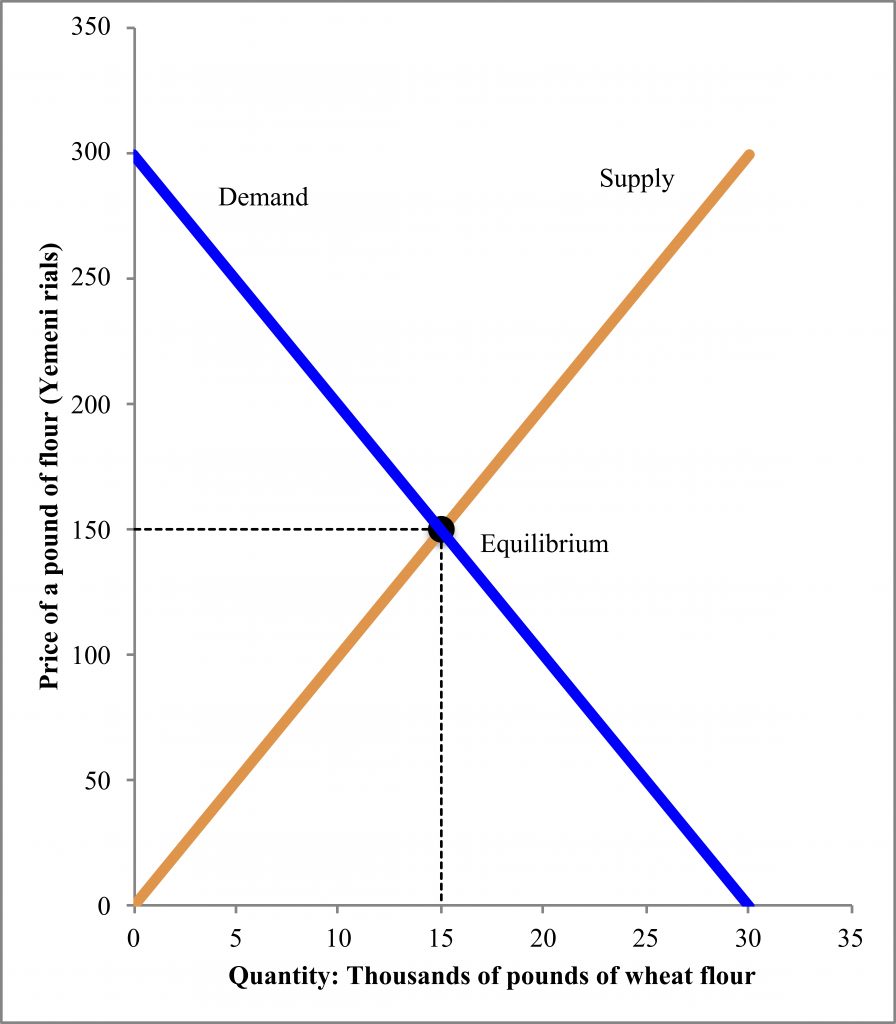
We can understand why markets will stay in equilibrium with a counter-example. What if the price decreased to 100 rials? Then quantity demanded (20,000) would be greater than quantity supplied (10,000). Some people would not be able to buy wheat flour—there would be a shortage (quantity demanded would be greater than quantity supplied) in the market. However, some enterprising shop, since they kept selling out, would surely raise the price of flour, maybe to 110 rials at first, then 120, then, 130, then 140. Other sellers would see that they, too, could raise prices. With each increase, although the shortage would be less, they would still sell out, until they reached 150 rials.
At 150 rials, if they raised their prices any further, say to 160 rials, there would be a surplus: quantity supplied would be greater than quantity demanded. A smart shop would lower its price, maybe to 155 rials at first, to make sure that it sold all of its flour. Other shops would follow suit, until they reached 150. Essentially, because quantity supplied equals quantity demanded, there is no motivation to change the price at equilibrium. Markets trend towards equilibrium through buyers and sellers acting in their own self-interest. The trend towards equilibrium from these unseen forces, without requiring any action on the part of society or government, is often referred to as the “invisible hand.”
What causes changes in supply and demand?
Supply and demand can help us understand not only why prices and quantities are what they are, but also why they change—or how we can change them, for instance, how we can decrease hunger by shifting supply and demand for food. This section is all about what causes changes, called shifts, in supply and demand.
Shifts in demand
What determines demand? There are five main factors that affect demand:
- Preferences
- Income
- Population
- Related goods’ prices
- Expectations about the future
Preferences—what people like—can be shaped by information (including advertising), new experiences, or social trends. For example, if people heard that neighbors got sick after cooking with wheat flour, they might then demand less. Or, if people heard that wheat flour was good for their health, they might demand more.
Income plays a very important role in demand. Demand shows what people want and can pay for—not simply the quantity they want. When income increases, demand for most goods and services increases. One of the reasons for high levels of hunger in Yemen has been long periods of government employees going without pay. This decreased their income, which decreased demand for all sorts of goods and services.
Population also plays an important role in demand. When there are more people, there is more demand for food; when there are fewer people, there is less demand for food. One of the challenges that Yemen is facing is that it has some of the world’s fastest population growth. The fertility rate is 5.3, which means a woman will, on average, have 5.3 children.[4] Yemen’s rapid population growth has increased the demand for food.
The prices of related goods can affect demand, but the effect depends on how the goods are related. Economists distinguish between goods that are complements—goods that go together—and goods that are substitutes—goods that can be used in the place of each other. For wheat flour, yeast might be a complement, since it goes with wheat flour when baking bread. If the price of a complement, such as yeast, increases, then demand for a good, such as wheat flour, will decrease. People will want to bake less bread and need less flour. Corn flour could be a substitute for wheat flour. If the price of a substitute, such as corn flour, rises, then demand for wheat flour will increase. Essentially, when the price of complements goes up, demand for a good goes down. When the price of a substitute goes up, demand for a good goes up. Likewise, when the price of a complement goes down, demand for a good will increase and when the price of a substitute goes down, demand for a good will decrease.
Expectations about tomorrow affect people’s demand today. If people expect the price of wheat flour to increase, they will demand more wheat flour now, in order to save and stock up for the future. Likewise, if they expect the price of wheat flour to go down soon, they will not demand as much wheat flour now.
Shifts in supply
What determines shifts in supply? There are four factors that can cause changes in supply:
- The costs of production
- The prices of related goods in production
- Sellers’ expectations
- The number of sellers
The costs of production are closely related to our last chapter. Although we did not put prices on inputs, we discussed how inputs (resources) and technology can increase or decrease production. The same factors affect costs. If inputs become less expensive, then supply will increase—farmers and shops will supply more food. Likewise, if technology improves, then supply will increase—farmers and shops will supply more food. However, if input prices increase, or technology is lost (uncommon), then supply will decrease. For the example of wheat flour, if seeds become less expensive, that is a decrease in input prices that would increase supply. Similarly, if the faculty of agriculture at Sana’a University in Yemen develops a new type of seed (technology) that doubles the size of the wheat plants that can grow in Yemen, that would increase supply.
The prices of related goods in production depend on the choices that farmers have. For example, in Yemen, sorghum is the most common crop.[5] If the price of sorghum increases, farmers may switch their wheat fields to sorghum, reducing the supply of wheat flour. Likewise, if the price of sorghum decreases, farmers may then decide to supply less sorghum and more wheat flour.
Sellers’ expectations have a similar effect to buyers’ expectations. If farmers expect that the weather will be good for wheat, they will plant more wheat, increasing supply. If they expect that they will not be able to get enough water to irrigate their wheat, they may decrease supply.
The number of sellers has a parallel effect to changes in population to demand. When there are more sellers, supply increases. When there are fewer sellers, supply decreases. Competition—how easy it is to enter a market and start a business—plays an important role in the number of sellers.
Analyzing shifts
Now that we understand how and why supply and demand change, we can start analyzing changes in the market and how they will affect the price and quantity of food—and thus hunger. Returning to our market for wheat flour, we can analyze the recent decrease in Somali refugees in Yemen and how it may impact the price and quantity of food in Amran governorate. Although Yemen has a number of its own development challenges, it has a long tradition of accepting refugees from other countries. It is the only country in the Arabian Peninsula to have signed the Refugee Convention.[6] When conflict erupted in Yemen in March 2015, there were 280,000 refugees, 255,000 of them Somalis. As the conflict has continued, some of these refugees have left Yemen and returned to Somalia. Our supply and demand model can help us predict what the impact of the Somali refugees leaving Yemen will be on food prices and quantity.
To figure out the impact of this (and other) changes on a market, we will undertake a four-step process:
- Draw the market (supply, demand, equilibrium (price and quantity)) before the change.
- Decide which curve(s) shifted. Supply, demand, or both?
- Decide what direction the curve(s) shifted. Did they increase or decrease?
- Draw the new equilibrium and compare the new price and quantity to the old price and quantity.
Let’s apply this process to our market for wheat flour in Amran governorate.
- Market before the change: Let’s say Figure 2.3 represents the market before the change. The equilibrium price is 150 rials and the quantity is 15,000 pounds.
- What shifted as a result of Somali refugees leaving Yemen? If we consider the factors that shift supply and demand, this is a change in the population in Yemen. Population affects demand.
- What direction did the curves shift? The population decreased as a result of the refugees leaving, so this represents a decrease in population, and therefore a decrease in demand (there are fewer people who want food).
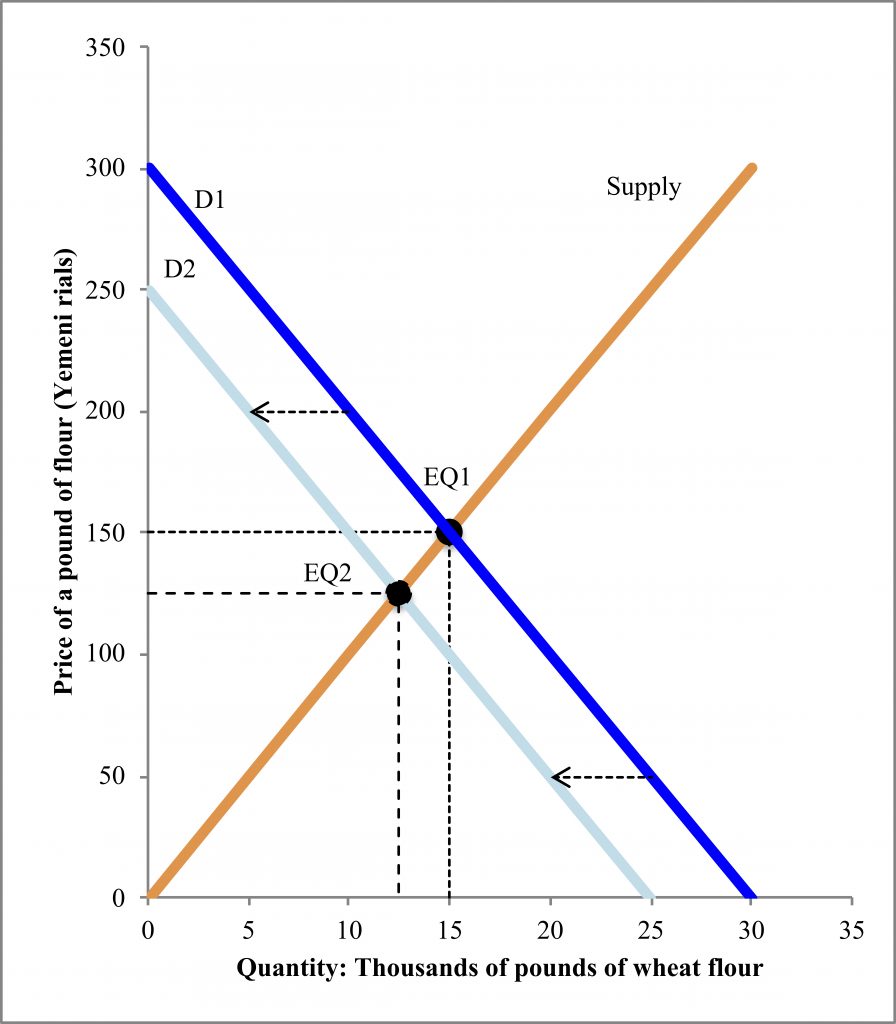
- We can draw this shift and the new equilibrium in Figure 2.4. The old equilibrium is labeled EQ1. The decrease in demand is a shift of the demand curve to the left, from the old D1 to the new D2. The supply curve stays the same. We find EQ2 where the new D2 meets the supply curve. At EQ2, the new equilibrium, the price is 125 rials and 12,500 pounds of flour. The decrease in demand led to a decrease in price and a decrease in quantity.
When we are thinking about shifts in demand, this will cover everything that is not on the graph changing—so everything except price and quantity. The shifts will then change demand, and thus change the equilibrium quantity and price. Here it is important to note that, while demand shifted, supply did not—there was just a movement along the supply curve that resulted in a different price and quantity.
When you are first learning to shift supply and demand, it may be tricky to keep track of what the shifts should look like. Here are a few tricks to help:
- Less (decrease) is a Left shift (both less and left start with L)
- More (increase) is a right shift (both more and right have Rs)
- You can also check that your shift makes sense graphically. If a curve decreased, you should be able to check that the quantity is less than it used to be at any price. If a curve increased, you should be able to check that the quantity is more at any price.
Now let’s work through another example. Due to the ongoing conflict in Yemen, the main port in Hodeidah was seriously damaged, reducing the ability of firms and aid groups from outside the country to bring in food.[7] Let’s think through how this change will affect the market for wheat flour in Yemen with our four-step process.
- Market before the change: Let’s say that Figure 2.3 represents the situation in Yemen before the port damage.
- What curve shifts? Here, the supply curve is shifting, because producers outside the country can no longer supply Yemen (number of suppliers).
- What direction is the shift? Fewer producers (able to access Yemen) means a decrease in supply.
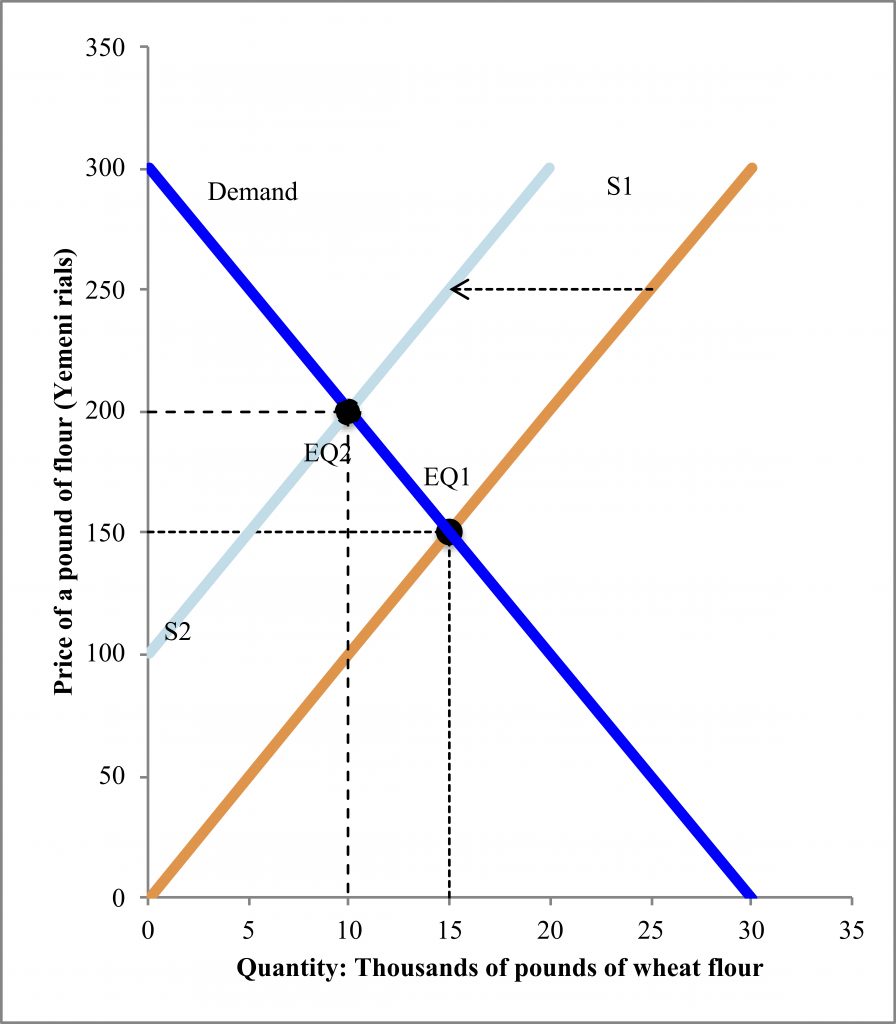
- We can draw this shift and the new equilibrium in Figure 2.5. Here we can see the old supply curve, S1, and the new, decreased supply, S2. The equilibrium shifts from EQ1, when the price was 150 rials and the quantity was 15,000, to EQ2, a price of 200 rials and a quantity of 10,000 pounds of flour.
Undoubtedly, one of the factors contributing to hunger and food insecurity in Yemen is the reduction in supply due to the damage to the main port and the inability of many suppliers to access the market.
These past two examples have illustrated how we can use the ideas of supply, demand, and markets to understand how current events affect the price and quantity of food—and thus hunger. We can use these same tools to model “what ifs” and make predictions as well. Let’s apply our four-step process to predict what happens if the conflict in Yemen ends. Specifically, let’s consider what happens to the wheat flour market if, simultaneously, Yemeni government employees all get their back pay AND the main port in Hodeidah reopens:
- Market before the change: Let’s say Figure 2.3 represents the market before the change. The price is 150 rials and the quantity is 15,000 pounds.
- What shifted as a result of employees getting their back pay and the main port reopening? Employees getting their back pay is about income—that’s demand. The main port reopening will affect supply. So, in this case, both curves shift.
- What direction did the curves shift? The income increase will increase demand for food. The main port reopening will increase the number of suppliers, thus increasing supply.
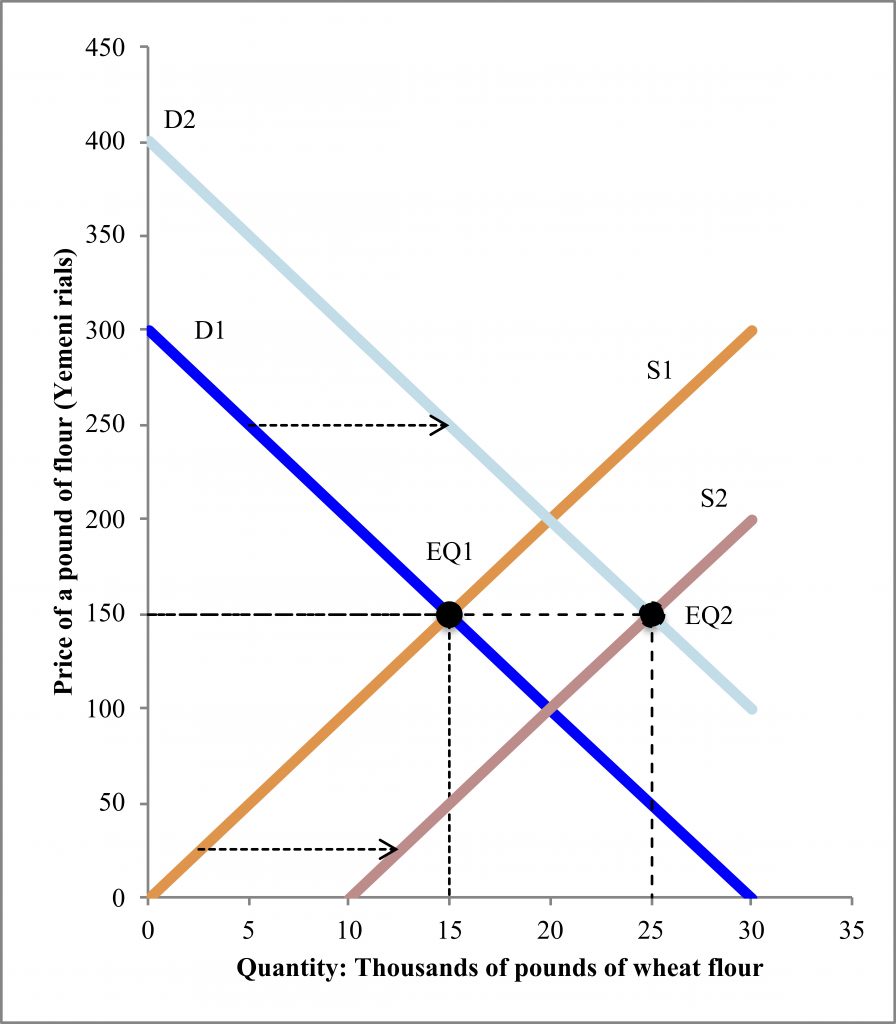
- We can draw this shift and the new equilibrium in Figure 2.6. The old equilibrium is labeled EQ1. The increase in demand is a shift of the demand curve to the right, from the old D1 to the new D2. The supply curve increases from S1 to S2. We find EQ2 where the new D2 meets the new S2 curve. At EQ2, the new equilibrium, the price is 150 rials and 25,000 pounds of flour. The increase in demand and the increase in supply led to an increase in quantity—but the exact same price! This is not always the case, though; the sizes of the shifts of the demand and supply curves determine whether the price changes or not—and the direction of the price change.
An important lesson from this example is that focusing just on price does not tell you whether people are better off. Given the increase in the quantity of food, hunger and food insecurity will decrease. Although people are better off, the price is the same. The WFP carefully monitors prices,[8] and rightly so, because they are an important part of the story—but not the whole story.
The four-step process for analyzing changes in markets can be applied to all sorts of situations, and we will continue to use it throughout future chapters. Next, we turn to two specific markets, and also start looking at policies that affect how markets function. First, we are going to consider the market for housing and rent control. Then we will turn to the market for labor and minimum wages.
Housing and rent control
Housing is one of the most basic needs of families. By 2030, three billion people will need new housing.[9] Existing housing suffers from inadequate quality, including poor access to water and sewage, and unsafe conditions. Housing affordability is also a major challenge for families throughout the globe.[10] Housing tends to be the single largest purchase of families.[11] What can countries do about these housing challenges? One common solution to housing affordability is rent control, a maximum price set on rents. Local, state, or national governments may enact rent control policies. The goal of rent control is laudable—making sure families can afford housing. However, an economic analysis of rent control demonstrates that the impact is much more complex. Rent control and other price ceilings—maximum prices for goods or services—create winners and losers.
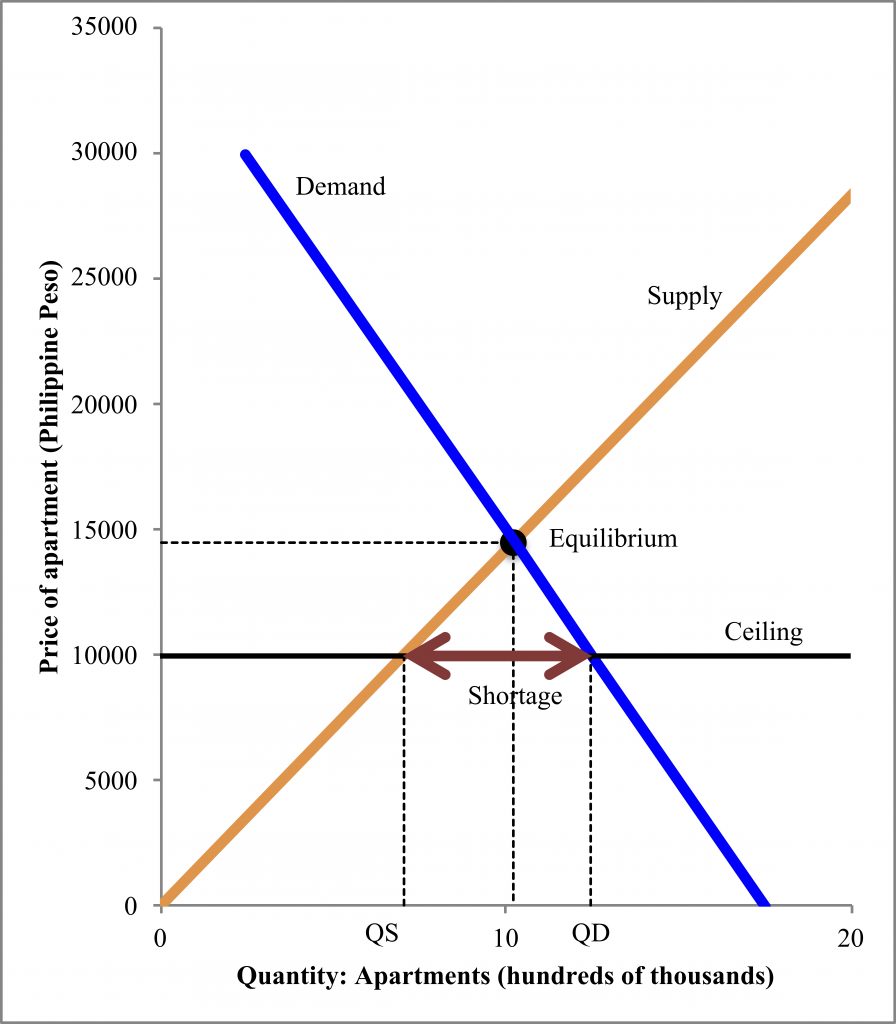
Figure 2.7 shows an economic analysis of rent control in the Philippines.[12] If there were no rent control, the price (in Philippine pesos) and quantity would be determined by supply and demand. The equilibrium would be a price of 14,518 pesos and quantity of 1.02 million apartments. However, in the Philippines, because of rent control, there is a price ceiling. The price of apartments has a maximum at 10,000 pesos. Rents cannot be higher than 10,000 pesos (rents cannot go higher than the ceiling). At a price of 10,000 pesos, the quantity demanded (QD) is 12.5 million apartments; this is where demand intersects the price ceiling. With the price ceiling, the quantity supplied is 7.05 million; this is where supply intersects the price ceiling. The quantity demanded is more (much more) than the quantity supplied. There is a shortage of rental housing of 5.44 million units. The market is not in equilibrium. Because of the price ceiling it cannot reach equilibrium.
As a result of rent control, there are a number of winners and losers in the Philippines’ rental market. Suppliers of apartments all lose—they receive less in rent than they would otherwise. On the demand side, there are a mix of winners and losers. Families who would like to rent but cannot find an apartment because of the shortage lose. Families who do get rent controlled apartments win; they pay less in rent than they would otherwise. Further economic analysis can demonstrate that the losses are larger than the benefits; rent control causes net harm to society. Empirical evidence also shows that, when rent control is implemented, landlords may shift into other markets.[13] For example, they may stop renting and sell their buildings. Ultimately, this reduces supply and further raises the market price of rentals, the exact opposite of rent control policies’ intentions.
The implications of most other price ceilings are similar to the impact of rent control. This finding does not mean that we have to despair about providing affordable housing—just that rent control is not the right solution. We will learn more about a more promising solution, subsidies,[14] in the chapter on education.
Labor and minimum wages
Price ceilings (maximum prices), such as rent control, are one type of price control. The other type of price control is a price floor, a minimum price. The most common price floor in the world is a minimum wage. To analyze minimum wages, we can study labor markets. In the labor market, the price is called the wage. To keep the numbers simple, we will use hourly wages, but workers can be paid hourly, daily, weekly, or in terms of an annual salary. The quantity of workers can be measured just as the number of workers (we will use that for now) or the total hours people work.
In the labor market, workers are the ones supplying their labor, while firms demand labor. Labor demand from firms depends, in part, on the productivity of workers. Firms only want workers because they will contribute to production. Labor supply by (potential) workers depends, in part, on the population and its characteristics. We will revisit labor supply decisions in the chapter on poverty to better understand how individuals choose how much to work. In the real world there are actually many labor markets, for different types of workers (professors of economics are in a different labor market from professors of political science). For now, we will start with a simple labor market including everyone, like in Figure 2.8, where we see that the labor market equilibrium is 20 million workers being paid $10 an hour.
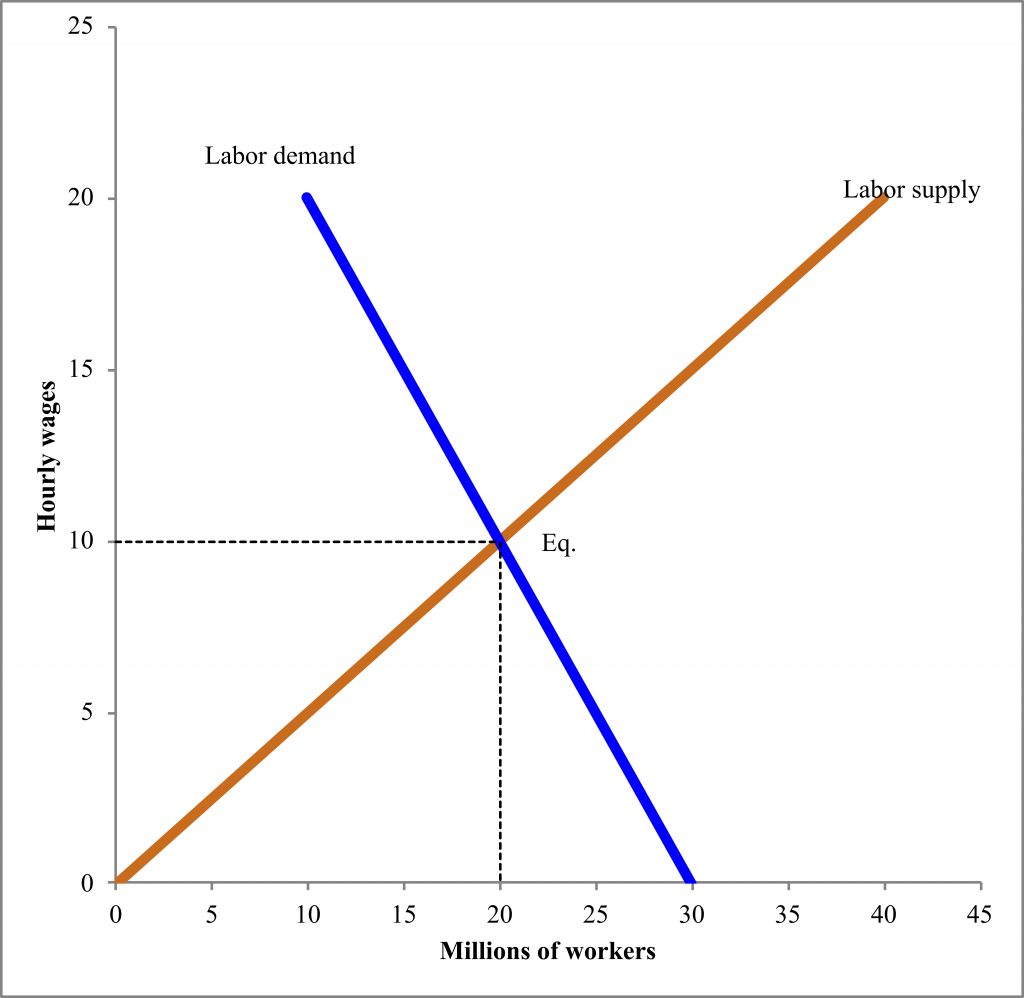
What effect will a minimum wage have on this labor market? That depends on where the minimum wage is relative to equilibrium. If the minimum wage is $7.25 an hour, as it currently is in the United States, then it will actually have no effect on our labor market in Figure 2.8. The equilibrium wage is already above the minimum wage at $10 an hour. A minimum wage of $7.25 has no effect, because firms would choose to pay workers more ($10) to get enough workers for their needs.
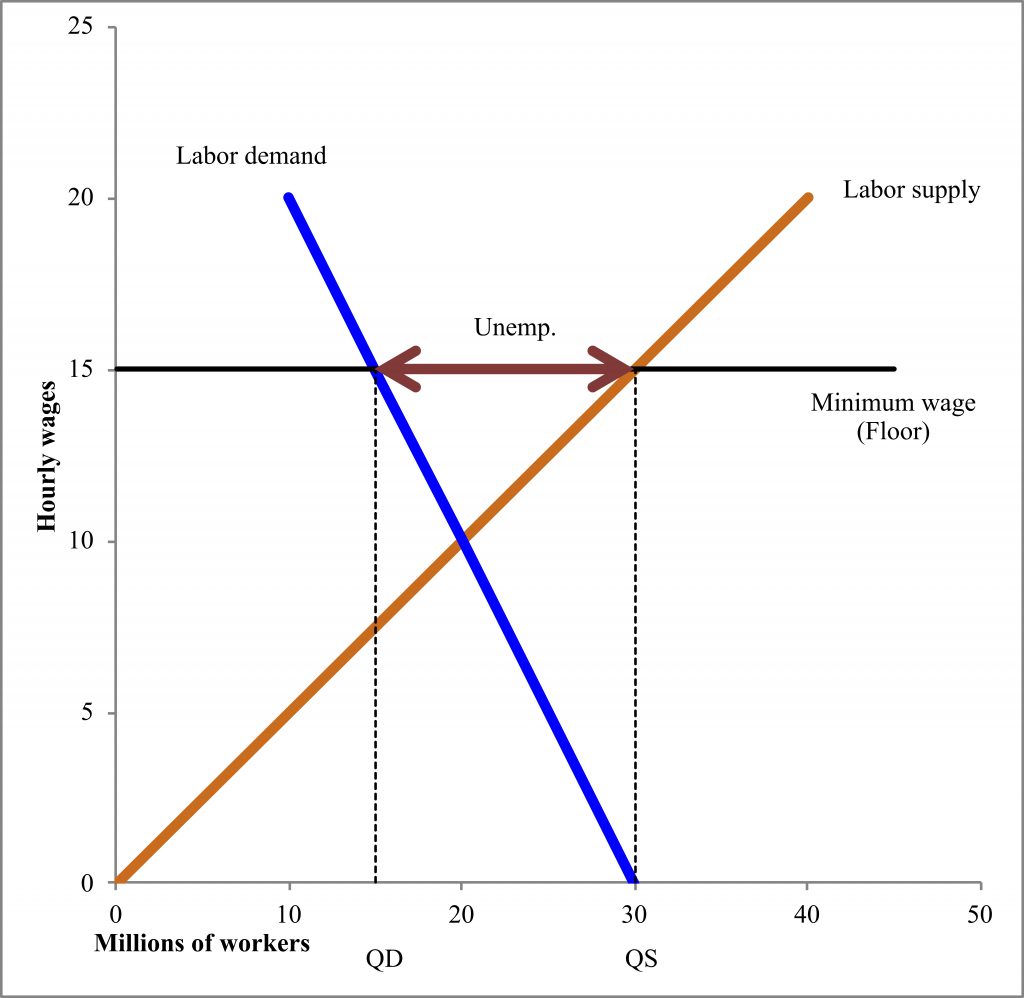
Within the United States, there have been a number of states and cities that have passed substantially higher minimum wages. New Jersey, Illinois, Maryland, Massachusetts, and New York have passed $15 minimum wages, which are in various stages of being phased in over time.[15] Minneapolis, Minnesota, and Seattle, Washington, are two examples of cities that have passed $15 minimum wages.[16] What will be the effects of these minimum wages on the labor market? We explore this possibility first in a very simple model, in Figure 2.9. Aside from the minimum wage being imposed, the figure is otherwise the same as Figure 2.8. The equilibrium wage would be $10 and the equilibrium number of workers 20 million. The price floor of the minimum wage now matters, because it is above the equilibrium. At a wage of $15 per hour, labor quantity demanded by firms would be only 15 million, but labor quantity supplied would be 30 million. As a result, 15 million people would be unemployed! Since the unemployment rate is the number of unemployed/labor supply, the unemployment rate would be 50%! This analysis is how minimum wages are often portrayed in introductory economics textbooks. The empirical evidence, however, does not align with this naïve model.
Minimum wage increases do not have large employment effects. The high-quality empirical studies of minimum wage increases typically show no employment effects (or even small increases in employment).[17] Why is the empirical evidence so different from the theoretical model? One reason is the shape of the naïve model in Figure 2.9. We have just been drawing easy lines, in the shape of an X, for supply and demand. The slope of the lines—whether they are steep or flatter—has been arbitrary. The shape or slope of the supply and demand curves depends on their elasticity. In general, elasticity refers to how much one economic variable—for example, quantity supplied—responds to changes in another economic variable—such as price. A demand or supply curve is elastic when there is a large change in quantity in response to a change in price. A demand or supply curve is inelastic when there is only a small change in quantity in response to a change in price. Typical introductory economics graphs show labor supply and demand as quite elastic—as in Figure 2.9. However, the empirical evidence suggests that labor supply and demand are inelastic.[18] Labor supply may even bend backwards (which is not normal for supply curves), because if you start to make more money, you may work fewer hours, a point we explore further in later chapters.[19] A good trick for learning elastic versus inelastic is that inelastic is shaped like an “I,” more straight up and down (showing only small changes in quantity when price changes).
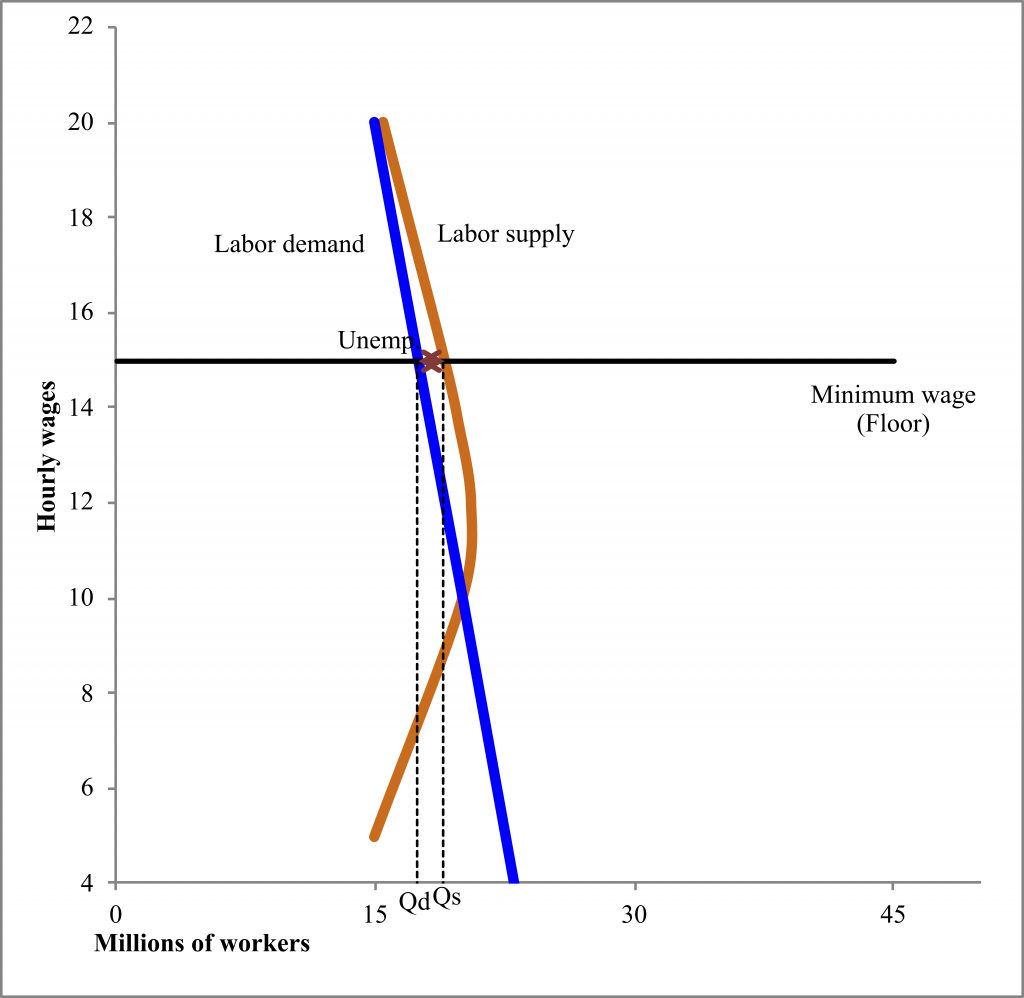
Figure 2.10 presents an alternative model of minimum wages, where labor demand is inelastic and labor supply is backward bending. The equilibrium wage and quantity would be the same as in Figure 2.8 and Figure 2.9. However, when the minimum wage (price floor) is implemented, the effect is very different. Wages rise to $15 per hour. The quantity demanded of labor is 17.5 million and the quantity supplied is 19 million, so there are 1.5 million unemployed—an unemployment rate of 8%. This is much smaller than the 50% in Figure 2.9.
The Figure 2.10 model is likely still too pessimistic in terms of unemployment effects relative to the empirical evidence on minimum wages. Why might minimum wages have, on average, no effect on employment? One reason is that labor is an input into the production of other goods. Recall, from earlier in the chapter, the reasons supply and demand might shift. One is input prices. Labor is an input into the production of almost every other good and service. When wages (labor prices) go up, firms may decrease their supply curves for all their other goods, such that prices increase. This brings up one concern about the effect of minimum wages—and one reason they may not have employment effects—is that increases in minimum wages may just be passed on as price increases. Some studies suggest that minimum wage increases simply become higher prices,[20] while others find no price effects.[21] If minimum wage increases are passed on in terms of prices, then minimum wages may be effective for reducing poverty and inequality,[22] but at the cost of higher prices to everyone.
Another reason that minimum wages may have no effect on employment is that when workers receive higher wages, they also spend more.[23] Recall that one of the factors that affects demand for goods and services is income. When income increases, demand increases. Thus, it may be the case that workers who receive higher minimum wages spend more. This spending increases the demand for goods and services. The increased demand for goods and services in turn increases the demand for labor to produce those goods and services. In the end, there may be no change in employment as a result of the combined effects of minimum wages and higher demand for goods and services.
A third reason that there may be no employment effects from minimum wage increases is that higher wages may make workers more productive. The additional output from workers may more than cover their higher wages. The idea that firms may pay their workers higher wages in order to increase productivity was a key insight of economist Janet Yellen, the U.S. Secretary of Treasury and former chairwoman of the Federal Reserve (the United States central bank, in charge of our money supply).[24] Higher minimum wages have been shown to increase productivity.[25] Reduced turnover as a result of higher wages may also be a substantial benefit to firms, as finding and training new workers decreases productivity.[26] These additional economic explanations demonstrate how overly simplified models (like Figure 2.9) can lead to faulty conclusions at odds with the empirical evidence on policies’ effects.
Conclusions
Markets are central to how all goods and services are allocated. Access to food, housing, and work depends on the functioning of markets. In this chapter, we have learned about supply and demand in markets. The supply and demand model shows how the price and quantity of goods and services are determined. This toolkit lets us analyze policies that change markets’ behavior. For instance, rent control is a price ceiling that lowers the price of housing—but reduces the quantity supplied. Minimum wages are a price floor that has complex consequences on markets. Although overly simple models suggest large unemployment effects from minimum wages, empirically there are, on average, no effects on employment. In future chapters, we will apply and expand our supply and demand models to analyze many other social policies and issues, such as pollution control, free education, and discrimination.
List of terms
- Market
- Supply (curve)
- Demand (curve)
- Quantity supplied
- Quantity demanded
- Price
- Equilibrium
- Shortage
- Surplus
- Substitute
- Complement
- Rent control
- Price ceiling
- Wage
- Price floor
- Minimum wage
- Unemployment
- Elasticity
- Elastic
- Inelastic
References
Aaronson, Daniel, Sumit Agarwal, and Eric French. 2012. “The Spending and Debt Response to Minimum Wage Hikes.” American Economic Review 102 (7): 3111–3139.
Alabsi, Ali Abdulmalek. 2006. “Country Pasture / Forage Resource Profiles: Yemen.”
Allegretto, Sylvia, and Michael Reich. 2015. “Are Local Minimum Wages Absorbed by Price Increases? Estimates from Internet-Based Restaurant Menus.” ILR Review 71 (1): 35–63.
Ballesteros, Marife M., Tatum P. Ramos, and Jasmine E. Magtibay. 2016. “Rent Control in the Philippines: An Update.” Philippine Institute for Development Studies Discussion Paper Series No. 2016–40.
Bosch, Mariano, and Marco Manacorda. 2010. “Minimum Wages and Earnings Inequality in Urban Mexico.” American Economic Journal: Applied Economics 2 (4): 128–149.
Boushey, Heather, and Sarah Jane Glynn. 2012. “There Are Significant Business Costs to Replacing Employees.” Center for American Progress.
Card, David, and Alan B Krueger. 1994. “Minimum Wages and Employment: A Case Study of the Fast-Food Industry in New Jersey and Pennsylvania.” The American Economic Review 84 (4): 772–793.
Chetty, Raj. 2012. “Bounds on Elasticities With Optimization Frictions: A Synthesis of Micro and Macro Evidence on Labor Supply.” Econometrica 80 (3): 969–1018.
Diamond, Rebecca, Tim McQuade, and Franklin Qian. 2019. “The Effects of Rent Control Expansion on Tenants, Landlords, and Inequality: Evidence from San Francisco.” American Economic Review 109 (9): 3365–3394.
Dube, Arindrajit. 2017. “Minimum Wages and the Distribution of Family Incomes.” IZA Discussion Paper Series No. 10572.
Dube, Arindrajit, T. William Lester, and Michael Reich. 2010. “Minimum Wage Effects across State Borders: Estimates Using Contiguous Counties.” The Review of Economics and Statistics and Statistics 92 (4): 945–964.
Ghobari, Mohammed. 2016. “Yemen’s War-Damaged Hodeidah Port Struggles to Bring in Vital Supplies.” Reuters (November 24).
Grandolini, Gloria M., and Ede Ijjasz-Vasquez. 2016. “3 Reasons Why ‘Housing for All’ Can Happen by 2030.” World Bank Blogs: Voices. https://blogs.worldbank.org/voices/3-reasons-why-housing-all-can-happen-2030.
Katz, Lawrence F., and Alan B. Krueger. 1992. “The Effect of the Minimum Wage on the Fast-Food Industry.” ILR Review 46 (1): 6–21.
Keane, Michael P. 2011. “Labor Supply and Taxes: A Survey.” Journal of Economic Literature 49 (4): 961–1075.
Lichter, Andreas, Andreas Peichl, and Sebastian Siegloch. 2015. “The Own-Wage Elasticity of Labor Demand: A Meta-Regression Analysis.” European Economic Review 80 (7958): 94–119.
Mantoo, Shabia. 2017. “As War Grinds on in Yemen, Somali Refugees Eye Return.” UNHCR (May 19).
National Conference of State Legislatures. 2019. “State Minimum Wages | 2019 Minimum Wage by State.” Retrieved December 12, 2019. http://www.ncsl.org/research/labor-and-employment/state-minimum-wage-chart.aspx.
Nelson, Emma. 2017. “Minneapolis Leaders Negotiate Timing of $15 Minimum Wage amid National Debate over Impact.” Star Tribune (June 27).
Reich, Michael, Sylvia Allegretto, and Anna Godoey. 2017. “Seattle’s Minimum Wage Experience 2015-16.” CWED Policy Brief. CWED.
Rizov, Marian, Richard Croucher, and Thomas Lange. 2016. “The UK National Minimum Wage’s Impact on Productivity.” British Journal of Management 27 (4): 819–835.
Sard, Barbara. 2001. “Housing Vouchers Should Be a Major Component of Future Housing Policy for the Lowest Income Families.” Cityscape: A Journal of Policy Development and Research 5 (2): 89–110.
Ruffini, Krista. 2020. “Worker Earnings, Service Quality, and Firm Profitability: Evidence from Nursing Homes and Minimum Wage Reforms.” Washington Center for Equitable Growth Working Paper Series.
Scommegna, Paola. 2012. “Yemen’s New Government Faces Long-Standing Demographic Challenges.” Population Reference Bureau. Retrieved August 24, 2017. http://www.prb.org/Publications/Articles/2012/yemen-country-spotlight.aspx.
Turner, Margery Austin, and G. Thomas Kingsley. 2008. “Federal Programs for Addressing Low-Income Housing Needs: A Policy Primer.” The Urban Institute.
UN-Habitat. 2016. World Cities Report 2016: Urbanization and Development – Emerging Futures. Nairobi, Keyna: UN-Habitat.
Walker, Renee E., Christopher R. Keane, and Jessica G. Burke. 2010. “Disparities and Access to Healthy Food in the United States: A Review of Food Deserts Literature.” Health and Place 16 (5). Elsevier: 876–884.
West, Rachel, and Michael Reich. 2014. “The Effects of Minimum Wages on SNAP Enrollments and Expenditures.” Center for American Progress.
WFP. 2017. “Yemen Market Watch Report.” WFP.
Wong, Sara A. 2019. “Minimum Wage Impacts on Wages and Hours Worked of Low-Income Workers in Ecuador.” World Development 116: 77–99.
Yellen, Janet L. 1984. “Efficiency Wage Models of Unemployment.” American Economic Review 74 (2): 200–205.
- WFP 2017 ↵
- Walker, Keane, and Burke 2010 ↵
- June 2017 prices from WFP 2017 ↵
- Scommegna 2012 ↵
- Alabsi 2006 ↵
- Mantoo 2017 ↵
- Ghobari 2016 ↵
- WFP 2017 ↵
- Grandolini and Ijjasz-Vasquez 2016 ↵
- UN-Habitat 2016 ↵
- Turner and Kingsley 2008 ↵
- Based on Ballesteros, Ramos, and Magtibay 2016 ↵
- Diamond, McQuade, and Qian 2019 ↵
- Sard 2001 ↵
- National Conference of State Legislatures 2019 ↵
- Nelson 2017; Reich, Allegretto, and Godoey 2017 ↵
- Card and Krueger 1994; Dube, Lester, and Reich 2010; Katz and Krueger 1992 ↵
- Chetty 2012; Lichter, Peichl, and Siegloch 2015 ↵
- Keane 2011 ↵
- Allegretto and Reich 2015 ↵
- Katz and Krueger 1992 ↵
- Bosch and Manacorda 2010; Dube 2017; West and Reich 2014; Wong 2019 ↵
- Aaronson, Agarwal, and French 2012 ↵
- Yellen 1984 ↵
- Rizov, Croucher, and Lange 2016 ↵
- Boushey and Glynn 2012; Ruffini 2020 ↵
