
8 Why is there pollution and what can we do about it?
Caroline Krafft
Global impact of pollution
Pollution places enormous costs on society. Diseases caused by pollution reduce the GDP of developing countries by as much as 2% per year.[1] Pollution contributes to almost 7% of health costs in developing countries and 2% in developed countries. According to one estimate, damages from pollution cost $4.6 trillion dollars per year, around 6% of global GDP.
Pollution takes a toll in terms of human lives and disproportionately affects children, lower income countries, minorities, and other marginalized groups. In 2015 alone, nine million people died prematurely due to pollution.[2] In the same year, deaths due to pollution were 16% of all deaths worldwide. The role of pollution in global mortality was triple that of malaria, AIDS, and tuberculosis combined. Pollution killed 15 times more people than war and violence.
Why is there so much pollution, doing so much harm across the globe? What can we do to reduce pollution? This chapter investigates the causes of pollution through an economic lens and evaluates a variety of policy options for reducing pollution. One of the challenges in addressing pollution is that it does not respect local, state, or national boundaries. Pollution is a global problem; this chapter also discusses the global policies and institutions to address pollution.
Pollution imposes costs on society
Pollution can take a variety of forms. It can be the release of harmful substances into the air, the water, or the soil. It can occur in food, in buildings (for instance, through mold), or in the form of energy. Pollution can take the form of light, heat, or noise. Noise pollution from ambient noise, such as traffic, affects children’s ability to learn.[3] Pollution can have negative effects on humans directly, such as when they breathe in sooty air, or indirectly, when pollutants damage our forests. Pollution imposes a cost on society, either directly or indirectly.
A helpful framework for thinking about the impacts of pollution when they are indirect or on the environment is the idea of environmental services (also sometimes called ecosystem services), the contributions of ecosystems to people’s wellbeing. For example, wetlands provide services by cleaning our water and preventing flooding. Trees help dissipate rain, absorb carbon dioxide and produce oxygen. Pollution damages or destroys these environmental services, depriving society of their valuable functions.
Pollution as an externality in production
We can model pollution as a cost to society by returning to our concept of an externality. When examining education, we focused on how, when children “consumed” education, there were positive spillovers to society. This was a positive externality in consumption. The marginal social benefit (MSB) was greater than the marginal private benefit (MPB). Now we will apply a similar concept to pollution. Pollution is typically generated through the production (supply) side of the market, and imposes a negative spillover on society, so it is a negative externality in production.
To model a negative externality, we can consider the case of corn. Agriculture along the Mississippi River, for instance corn farming, uses intensive quantities of fertilizers that enter the water as nitrogen and phosphorous.[4] These harmful chemicals flow through the river’s basin, eventually flowing downstream and creating a “dead zone” in the Gulf of Mexico. This harm is a negative externality from producing corn. The farmers making the decision of how much fertilizer to apply in Minnesota do not live in the Gulf of Mexico, where the fish will die due to algae blooms brought on by fertilizer. The farmers are imposing costs on others, costs that they do not consider in their decision to use fertilizer and grow corn.
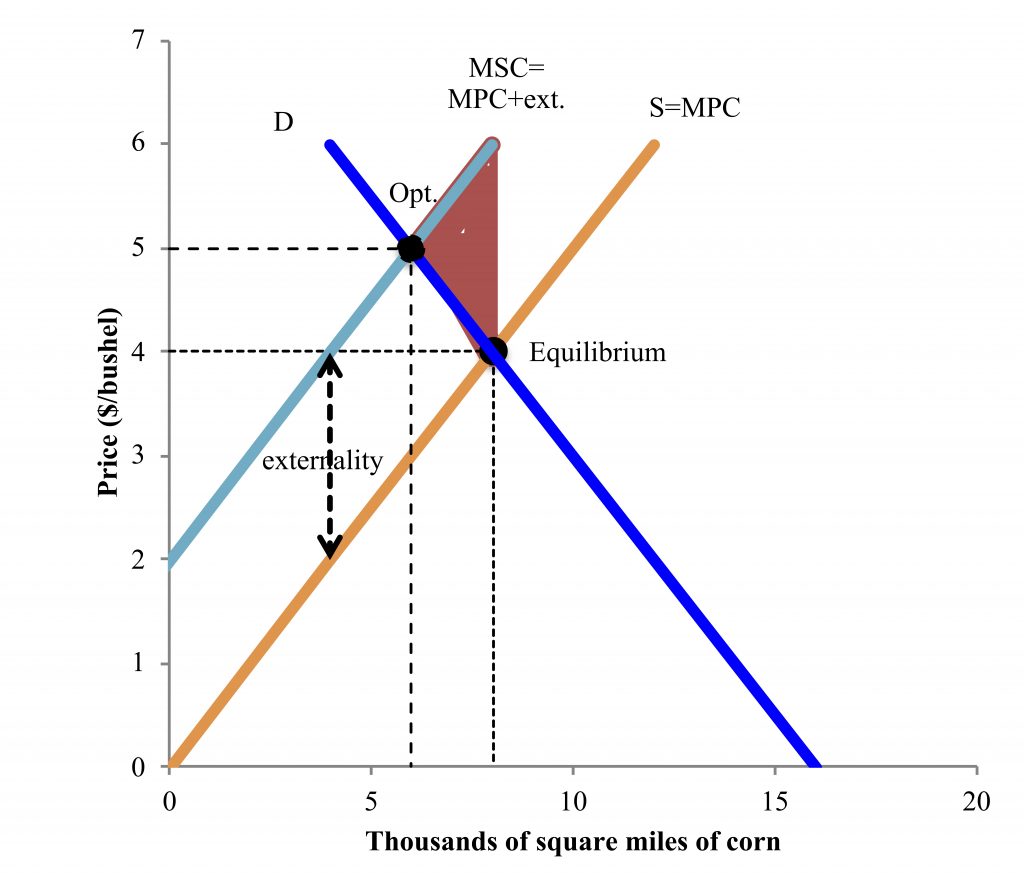
To model how this externality affects the economy, Figure 8.1 shows corn production in terms of thousands of square miles of corn and the price of corn ($/bushel). The supply curve is based on the marginal private cost (MPC). Corn farmers decide how much corn to produce based on their private costs. They have to pay for the bags of fertilizer, the seeds, and the tractor. However, they do not have to pay for the harm caused by the bag of fertilizer to the waterways, environment, and ultimately society. This negative externality means that the marginal social cost (MSC) differs from the MPC. Akin to MSB, MSC=MPC + externality. Society bears the private costs plus the spillovers. However, the equilibrium outcome in the corn market is determined by supply (MPC) meeting demand (MPB). In the figure, this is a price of $4/bushel and 8,000 square miles of corn being farmed.
When there is an externality, the market equilibrium is different than the social optimum, a case of market failure. Here, there is an externality of $2/bushel in environmental harms. In this case the social optimum is where the demand (=MSB, assuming no externalities in consumption) meets the MSC. A price of $5/bushel and 6,000 square miles farmed would be socially optimal. With a negative externality in production, too much corn is produced (8,000 square miles), and the price is too low ($4/bushel). We can actually estimate the loss to society from producing too much corn, after taking into account the harms to society from agricultural pollution. The area in red on the figure is what is referred to as the deadweight loss to society; the amount of money we, as a society, lose when pollution occurs because of production at the equilibrium level rather than the social optimum. This loss is the area of a triangle determined by the size of the externality. It is the area where the social costs (MSC) exceed the social benefits (MSB=demand), generating a loss to society.
Box 8.1. Lead poisoning in Flint, Michigan[5]
Climate change: a pollution case study
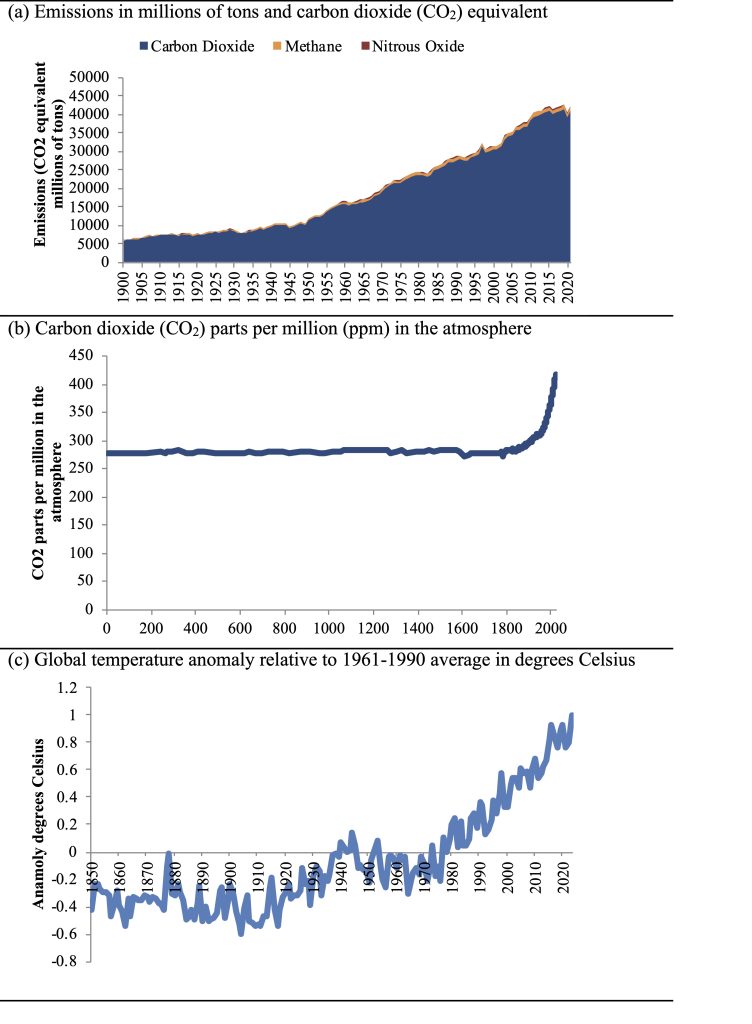
Climate change is an effect of certain types of pollution. To understand what climate change is, we can start with the idea of weather. Weather changes day to day (if you don’t like the weather, wait five minutes!). Climate is the long-run trend or pattern in weather. Climate change is the shift in climate over time, including higher temperatures and more extreme weather events, that human behavior has caused. Figure 8.2[6] shows a number of measures of climate change and humans’ role in that change. The first panel shows the human-created emissions of greenhouse gases. The greatest emissions are in the form of carbon dioxide. The other gasses are shown in their carbon dioxide equivalents. Emissions have been rising steadily for some time, particularly as we burn more gas and fuel. As a result of our emissions, the concentration of carbon dioxide in the atmosphere is rising (panel b). This carbon dioxide in turn contributes to rising temperatures (panel c). Temperatures since the 1970s have been rising above the long-term average, to the point that they were, by 2023, nearly one degree Celsius above the historic trend.
This pollution and global warming have important consequences for our environment and communities. The people and countries that climate change will impact the most are the most vulnerable. Communities that are highly reliant on agriculture are being exposed to the greatest increase in risk and environmental degradation.[7] Not only are these communities the most at risk from the harms of climate change, but they are also the ones who have contributed the least to climate change.
How can we address pollution?
Pollution is an enormous problem, but how can we address it? Abatement is the process or preventing or cleaning up pollution. There are a number of different ways to prevent pollution or to incentivize individuals and firms to create less pollution. One approach is direct government action, through preserving wetlands or cleaning waterways. Cost-benefit analysis can be used to compare the effectiveness of these different approaches. However, these approaches do not necessarily prevent pollution from happening in the first place or prevent the loss to society. In this section, we will examine several different policy options for addressing pollution through regulations or incentives.
Limiting pollution through command-and-control
Command-and-control approaches to pollution specify how much pollution a particular polluter can emit, or particular pollution-abatement technologies firms must adopt. For example, numerous countries have regulations around Nitrous Oxide (NOx) emissions, which are a form of air pollution primarily emitted from diesel vehicles. Countries have regulations on how much NOx vehicles can emit. This is a command-and-control approach applied to the emissions from each tailpipe.
Evasion of such regulations may be a problem; the recent Volkswagen scandal, in which VW vehicles were designed to “cheat” pollution tests, illustrates the harms of evasion—up to a million extra tons of NOx per year.[8] Command-and-control solutions require vigorous monitoring and enforcement. For example, the Chinese government, in the fall of 2017, started cracking down on pollution after public outcry around air quality.[9] They took a command-and-control approach, including banning coal in certain areas, closing down thousands of coal-fired furnaces, and coal-fired generators.
An underlying assumption of command-and-control regulations is that firms should all take the same approach to addressing pollution. In reality, firms may have different technologies of production, which means they face different costs, so command-and-control is inefficient. Additionally, once they are within the command-and-control standards, firms face no incentives to keep abating. For example, car manufacturers face no incentive to have lower pollution than is mandated.
Taxing pollution
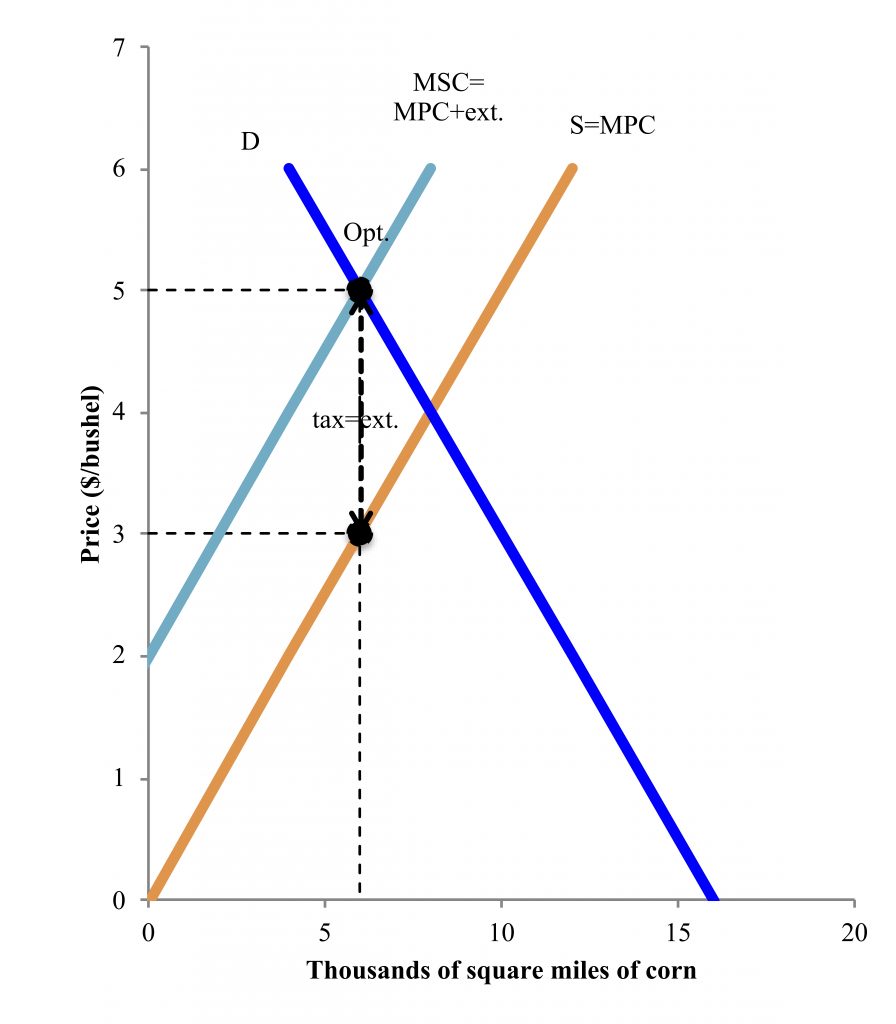
A more flexible and efficient approach to addressing pollution is to tax polluting goods. Assuming we know (at least approximately) the size of the externality from a good, we can create a tax that is equivalent to the externality. With this tax, firms face an additional input cost. Ideally, they will now face essentially the MSC as their costs, and choose the social optimum, as shown in Figure 8.3 for corn. Implementing this tax policy requires substantial information on what the size of the tax should be, as well as how much corn contributes to pollution. When the tax makes corn production too expensive for certain farmers, they will stop producing corn, reducing the pollution in the environment and achieving the social optimum.
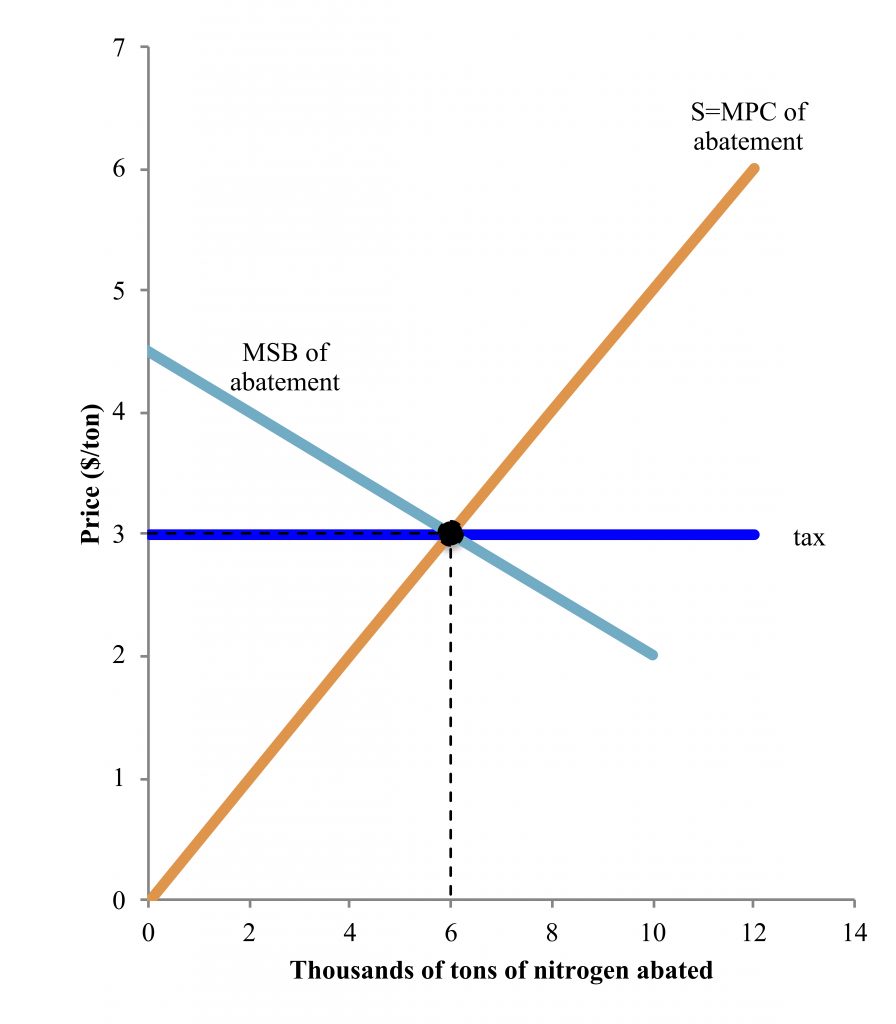
Particularly when the government struggles to figure out how much pollution a particular good or service creates or how large the externality from that pollution is, taxing pollutants directly may be a more effective approach. Figure 8.4 models this possibility. The good we are considering is the quantity of abatement in thousands of tons of NOx abated (not polluted). The price is dollars per ton to abate. For some firms it will be very easy to abate, but the costs of abatement will rise as “easy” strategies are implemented and only the more difficult forms of abatement remain. This leads to a supply curve sloping upward with increasing MPC of abatement. The social benefits of abatement (the demand curve for abatement) will also decline as we move from acute health hazards to less dangerous levels. Where the MSB of abatement equal the MPC of abatement, this is the price where we should set our tax. In the example, this is a tax of $3/ton, with 6,000 tons of nitrous oxide abated.
The advantage of these pollution taxes is that they encourage firms that have lower costs of abatement to undertake abatement (for instance switching to cleaner energy), while those that face high costs of abatement (for example, who have poor access to solar or wind energy) can continue to pollute and pay the tax. A global example of a pollution tax is carbon taxes, which directly tax carbon dioxide. One challenge with implementing a tax on pollution is that it requires the government to have information on abatement costs, which may be difficult to obtain accurately, as firms have incentives to lie.
Pollution permits: Cap and trade
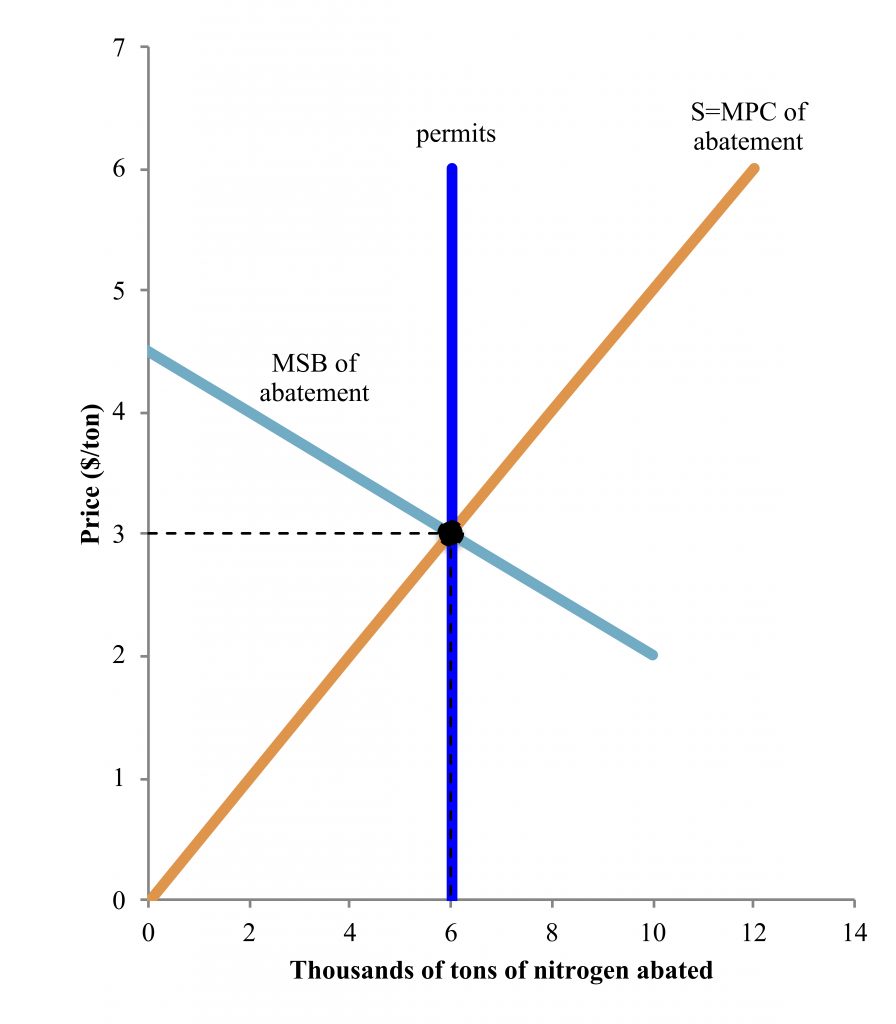
An alternative to placing a price (tax) on pollution is to set the quantity of pollution. Permits for the optimal quantity can be auctioned off and traded. This is a cap-and-trade (pollution permit) strategy. Figure 8.5 shows this abatement strategy, where again we are looking at the price and quantity of abatement for NOx. Again, we pick the optimal point, where MSB=MPC for abatement. Here we set that number of permits rather than the tax. However, this will lead to exactly the price of the tax. Economically, taxes and permits are equivalent. In both cases (from the tax or the permit) the government gets revenue. In contrast to tradable permits, command-and-control approaches can be considered a non-tradable permit to pollute a certain amount.[10] The advantage of tradable permits, as with taxes, is that they allow firms with lower costs of abatement to abate more, while firms with higher costs of abatement can buy permits and abate less. The total amount of abatement is the same, but the costs to firms to achieve that abatement are reduced relative to command and control. Additionally, unlike with taxes, as the costs of abatement change over time, the permits can change price.
Should we aim for no pollution?
The theme of the 2017 annual UN Environment Assembly meeting in Nairobi, Kenya was “Towards a Pollution-Free Planet.” Should we aspire to this goal of zero pollution? Certainly, our economic analysis showed that we must account for externalities and the social costs of pollution. However, we know that in general—as for our other economic analyses in areas such as crime and education—we want to undertake action so long as the economic benefits of doing so outweigh the economic costs. The analysis above did not lead us to a state where we had no corn farming at all, but it did reduce the quantity of corn. Likewise, we did not set the number of permits at zero. We would only want to reduce pollution to the point that the benefits of reducing pollution outweighed the costs. This might be no pollution at all, or instead, it might be a lower level of pollution, due to the rising costs of abatement as the quantity of abatement increases.
Global agreements to address pollution
One of the challenges in tackling the global issue of pollution is that its effects are felt across national borders. Air pollution in one city affects air quality for its neighbors. Wildfires in Washington reduce air quality in Minnesota. Pollution challenges also cross a number of sectors. There are effects on health, the environment, and the economy. One of the organizations that focuses on the health effects of pollution is the World Health Organization (WHO). The “health impacts of climate and environmental change” are one of the WHO’s current top priorities in health.[11] Achieving the global Sustainable Development Goals (SDGs) depends on addressing pollution. For example, reducing pollution is critical to improving health, reducing poverty, improving access to water and sanitation, and other goals.[12]
The current global framework for addressing climate change is the Paris Agreement.[13] Every country in the world except the United States has signed the Paris Agreement. The agreement aims to keep global temperature increases below 1.5-2.0 degrees Celsius, the critical tipping point for irreversible environmental change. However, the specific targets and contributions set forth in agreement are estimated to lead to an increase of 2.4-2.7 degrees Celsius by 2100. Further commitments and more progress will be needed. The agreement includes commitments by developed countries to help support developing countries, an attempt to address the disproportionately high impact of climate change on developing countries, despite their disproportionately low contributions to climate change.
Box 8.2. Climate treaties can work: The 1987 Montreal Protocol and the Ozone Layer[14]
The ozone layer of the atmosphere helps absorb most of the sun’s ultraviolet radiation. This radiation can cause skin cancer as well as environmental harms. In the 1970s, certain chemicals were identified as pollutants that had a harmful externality: they were damaging the ozone layer, creating an ozone hole over the Antarctic. In 1987, the Montreal Protocol was an international treaty signed to limit ozone-depleting chemicals. The prevalence of the chemicals peaked in 1993 and began to decline thereafter. Recent research suggests that the protocol and averted between 8% and 15% of certain skin cancers in affected areas.
Summary and conclusions
There has been growing recognition of the global threat to our lives, ecosystems, and economies posed by pollution. Pollution is generated by firms’ production and imposes negative externalities on society. These negative externalities are a form of market failure; firms will produce too much of these polluting goods. Government intervention is required to overcome this market failure. There are multiple forms this intervention can take, including command-and-control approaches, taxes on goods that pollute or directly on pollution, or tradable permits for pollution. Command-and-control approaches regulating pollution are not efficient, but in certain situations may be easier to implement than taxes or permits. All of these methods require good information on the effect of externalities, such as the health costs of pollution, as well as the costs of abatement. Gathering this information is an important area of work in the field of environmental economics.
The externalities of pollution know no borders; pollution is a global challenge. When local, state, or national governments take action on pollution, their decisions will not be optimal if they only account for the harms and externalities in their own communities. A global analysis of the consequences of pollution is required. The current global framework for tackling climate change—the Paris Agreement—is insufficient to prevent long-term, irreversible damage. More needs to be done to address climate change and other forms of pollution.
List of terms
- Negative externality in production
- Marginal Private Benefit (MPB)
- Marginal Social Benefit (MSB)
- Marginal Private Cost (MPC)
- Marginal Social Cost (MSC)
- Social Optimum
- Market failure
- Deadweight loss
- Environmental services
- Climate change
- Abatement
- Command and control
- Taxing polluting goods
- Carbon taxes
- Cap-and-trade/Tradable permits
- Paris Agreement
References
Aizer, Anna, Janet Currie, Peter Simon, and Patrick Vivier. “Do Low Levels of Blood Lead Reduce Children’s Future Test Scores?” American Economic Journal: Applied Economics 10, no. 1 (2018): 307–41.
Busby, Mattha. “One in Three Cars in VW Emissions Scandal yet to Be Fixed, Figures Show.” The Guardian, November 7, 2017.
Chipperfield, M. P., S. S. Dhomse, W. Feng, R. L. McKenzie, G. J. M. Velders, and J. A. Pyle. “Quantifying the Ozone and Ultraviolet Benefits Already Achieved by the Montreal Protocol.” Nature Communications 6, no. 7233 (2015): 1–8. doi:10.1038/ncomms8233.
Das, Pamela, and Richard Horton. “Pollution, Health, and the Planet: Time for Decisive Action.” The Lancet 6736, no. 17 (2017): 1–2. doi:10.1016/S0140-6736(17)32588-6.
Hanna-Attisha, Mona, Jenny LaChance, Richard Casey Sadler, and Allison Champney Schnepp. “Elevated Blood Lead Levels in Children Associated with the Flint Drinking Water Crisis: A Spatial Analysis of Risk and Public Health Response.” American Journal of Public Health 106, no. 2 (2016): 283–90. doi:10.2105/AJPH.2015.303003.
Landrigan, Philip J., Richard Fuller, Nereus J. R. Acosta, Olusoji Adeyi, Robert Arnold, Niladri (Nil) Basu, Abdoulaye Bibi Baldé, et al. “The Lancet Commission on Pollution and Health.” The Lancet 6736, no. 17 (2017). doi:10.1016/S0140-6736(17)32345-0.
https://www.metoffice.gov.uk/hadobs/hadcrut5/data/current/download.html.
Michigan Civil Rights Commission. “The Flint Water Crisis: Systemic Racism through the Lens of Flint,” 2017.
Moore, Colleen F. Silent Scourge: Children, Pollution, and Why Scientists Disagree. Oxford, UK: Oxford University Press, 2009.
Muennig, Peter. “The Social Costs of Lead Poisonings.” Health Affairs 35, no. 8 (2016): 1545. doi:10.1377/hlthaff.2016.0661.
Needham, Kirsty. “In China, the War on Coal Just Got Serious.” Sydney Morning Herald, October 13, 2017. http://www.theage.com.au/world/in-china-the-war-on-coal-just-got-serious-20171011-gyyvi6.html.
Neira, Maria, Michaela Pfeiffer, Diarmid Campbell-Lendrum, and Annette Prüss-Ustün. “Towards a Healthier and Safer Environment.” The Lancet 6736, no. 17 (2017): 1–2. doi:10.1016/S0140-6736(17)32545-X.
Nilsson, Annika, ed. Social Scientists on Environmental Policy. Nordic Council of Ministers, 1999.
Ribaudo, Marc O., Ralph Heimlich, Roger Claassen, and Mark Peters. “Least-Cost Management of Nonpoint Source Pollution: Source Reduction versus Interception Strategies for Controlling Nitrogen Loss in the Mississippi Basin.” Ecological Economics 37, no. 2 (2001): 183–97. doi:10.1016/S0921-8009(00)00273-1.
Richardson, Leslie, John Loomis, Timm Kroeger, and Frank Casey. “The Role of Benefit Transfer in Ecosystem Service Valuation.” Ecological Economics 115 (2015): 51–58. doi:10.1016/j.ecolecon.2014.02.018.
Ritchie, Hannah, Max Roser, and Pablo Rosado. “CO2 and Greenhouse Gas Emissions.” Our World in Data, 2020. https://ourworldindata.org/co2-and-other-greenhouse-gas-emissions.
United Nations Development Programme. Human Development Report 2016. United Nations Development Programme, 2016. doi:eISBN: 978-92-1-060036-1.
- Landrigan et al., 2017. ↵
- Ibid. ↵
- Moore, 2009. ↵
- Ribaudo et al., 2001. ↵
- Hanna-Attisha et al., 2016; Muennig, 2016; Michigan Civil Rights Commission, 2017; Aizer et al., 2018. ↵
- Ritchie, Roser, and Rosado, 2020. ↵
- United Nations Development Programme, 2016. ↵
- Busby, November 7, 2017. ↵
- Needham, October 13, 2017. ↵
- Nilsson, 1999. ↵
- Neira et al., 2017. ↵
- Landrigan et al., 2017. ↵
- United Nations Development Programme, 2016. ↵
- Chipperfield et al., 2015. ↵
