
1 Production: Can we end hunger?
Caroline Krafft
Can we end hunger?
In Yemen, 17 million people are food insecure, which means they do not have enough to eat.[1] There are 3.5 million children and women in Yemen who are so malnourished they require urgent treatment. Two-thirds of children under the age of five in Yemen are so chronically malnourished that their growth has been stunted.[2] This rate is an increase in malnutrition from previous decades, when around half of children were stunted.[3] In the long term, these malnourished children will learn less (if they attend school), earn less when they work, and have poorer health throughout their lives.[4] Conflict in Yemen has moved the country closer to famine.[5]
Food security exists when all people, at all times, have physical and economic access to sufficient safe and nutritious food that meets their dietary needs and food preferences for an active and health lifestyle.
–1996 World Food Summit
In the United States, there are 14 million food insecure households (10 percent of households).[6] There are 5 million children in the United States who are in households where food insecurity is affecting children.[7] Despite programs designed to prevent hunger, such as food stamps, children and families are still suffering from hunger in the United States. These children perform worse in school near the end of the month—when their food stamps have run out.[8]
Although the United States is a much wealthier nation than Yemen, and hunger is a less common issue, both countries still fail to meet the most basic needs of all of their citizens—starting with food. This chapter introduces the economics of production—how countries create and distribute resources—to help us think about what it would take to end hunger.
How can economics help us end hunger?
Economics is the study of how societies allocate their scarce resources. In both Yemen and the United States—and around the world—understanding the allocation of scarce resources is critical to addressing hunger. Food itself is a scarce resource when families go hungry. Producing food depends on a number of different inputs, such as land, water, and seeds, which are also scarce. Economics can help us think about how to allocate food to people so we can reduce or eliminate hunger. One of the ways economics can help end hunger is by helping us allocate not just food, but the inputs that produce food.
Economists think about allocation decisions on two levels. The first is microeconomics, thinking about the behavior of individuals or firms. When thinking about hunger, a microeconomic focus might be on how farmers choose between different crops or decide how much water to allocate to each crop. The second type of economics is macroeconomics, the study of the economy of a nation (or a region or the world) as a whole. Macroeconomics would shift the focus to the output of an entire nation or state. This text covers both macroeconomic and microeconomic topics.
How do we produce food?
Whether we are thinking about a single farm (microeconomics) or a nation (macroeconomics), how much food (output) it can produce depends on inputs (seeds, land, farmers). Economists divide inputs into two types—labor and capital. Labor consists of the people (human inputs) that can potentially produce goods and services. When we are thinking about a family farm, labor would be the number of hours family members could work on the farm. Since there are only a fixed number of hours in the day, labor is a scarce resource. When we’re thinking about the entire economy, labor might be measured in millions of workers.
Economists typically measure labor in hours or number of workers. However, this assumes workers are all able to produce the same amount of food, which is not accurate. How much workers can produce depends on a variety of factors—such as their skills or their health. Economists call these aspects of labor human capital. Human capital is the information, skills, knowledge, education, and health of workers. It shapes their ability to translate their time into production. For example, an experiment in Guatemala demonstrated that children who received a nutrition supplement during childhood were more productive as adults, earning higher wages, because of the investment in their health—their human capital.[9] Likewise, when students go to college, they expect to be more productive and earn more as adults, because they have invested in their human capital. One way to think about human capital is that labor tends to refer to the quantity of labor, while human capital is one way for economists to think about the quality of labor.
In order to produce food, farms need not only labor and human capital, but also physical capital. Physical capital consists of the physical inputs, such as tractors and land, that help produce outputs. Physical capital also includes infrastructure—roads, electricity, water, and other public works that facilitate production. Natural resources (such as minerals or oil) also are a form of physical capital. Land, water, seeds, and fertilizer are examples of important physical capital inputs that contribute to the production of food.
Technology is the final element of production. Technology refers to the inventions or innovations, as well as new ways of organizing work, that allow us to produce more even with the same amount of inputs. For example, in West and Central Africa, the International Institute of Tropical Agriculture and the International Maize and Wheat Improvement Center work on improving the varieties of maize (a key food crop) available.[10] Essentially, they invent new varieties of maize with enhanced capabilities, such as drought resistance. The emerging technology of new maize varieties allows farmers to produce more food with the same amount of land and labor.
It can be confusing to try to distinguish between technology and capital. Is a new irrigation system technology or is it capital? The technology (idea) of drip irrigation to water crops has been around for decades.[11] However, as Box 1.1 demonstrates, not everyone adopts, or utilizes, new technology. Only when technology is adopted can it be classified as physical capital. Some farmers do not invest in the capital of drip irrigation. The farmers who do invest in drip irrigation have it as part of their capital.
The combination of inputs is also important. A simple example of this would be that, on a farm operated by tractors, you would need a driver (labor) for each tractor (physical capital). Any tractor that sits idle due to a lack of driver will not add anything to production. Thus, labor, human capital, and physical capital work best together. Some forms of physical capital, such as hybrid seeds, are more likely to be adopted and can be used more effectively by educated individuals.[13]
How can we produce more food?
Now that we have thought through how food is produced, we can turn to a central question for reducing hunger: how can we produce more food? A straightforward answer would seem to be more inputs—and more technology. However, where do these inputs and technology come from? We have to invest in them in the long run (over a long period of time). In the short run (for example, this year), our inputs and technology are fixed. If we want to produce more food, we are going to have to use our inputs differently. This section examines how to produce more food, first in the short run, and then in the long run.
Producing more food in the short run
The scarcity of resources is a key economic insight. If we want more workers on the farm, we will have to accept fewer workers in schools or factories. This is the central economic concept of tradeoffs. The saying “there is no free lunch” illustrates this idea. You have to give up something to get something. Economists often use models to think about these tradeoffs. Models are simplifications of the real world that help us think about economic issues—like the tradeoffs involved in producing more food.
The specific model for thinking about how a household or a country might produce more food is called the production possibilities frontier. A production possibilities frontier shows what can currently be produced, given current resources (physical capital, labor, human capital, and technology). With this model, we simplify to a world where there are two goods. In real life, there are millions of different possible goods and services we can produce, but focusing on just two helps us think through critical tradeoffs. The insights gleaned from this simple model can then be applied to any number of goods.
Figure 1.1 is a production possibilities frontier for food and housing. Here we are thinking on country scale, in terms of millions of tons of food, and millions of housing units (houses). Food is measured on one axis (the x-axis) and housing is on the other axis (the y-axis). Let’s say that this country is Yemen, where there is widespread food insecurity and hunger. Yemen faces a tough choice and important tradeoffs, symbolized by the production possibilities frontier. Yemen (currently, in the short run) has a fixed amount of resources (physical capital, labor, human capital, and technology). The curve—called the frontier—shows the different combinations of goods (food and housing) that Yemen can produce given its current resources. The frontier is the maximum possible. Any point on the frontier represents a particular combination of food and housing. To produce more of one good, Yemen has to give up some of the other good. Point A is one extreme: all food, 30 million tons. However, this means that Yemen builds no housing. Point B is the opposite extreme: 15 million housing units and no food. The remaining points are a mix of goods. Point C is more food (26 million tons) and less housing (7.5 million units). Point D is more housing (14.6 million units) and less food (7.3 million tons). Point E is a mix in the middle, 21.5 million tons of food and 10.4 million units of housing.
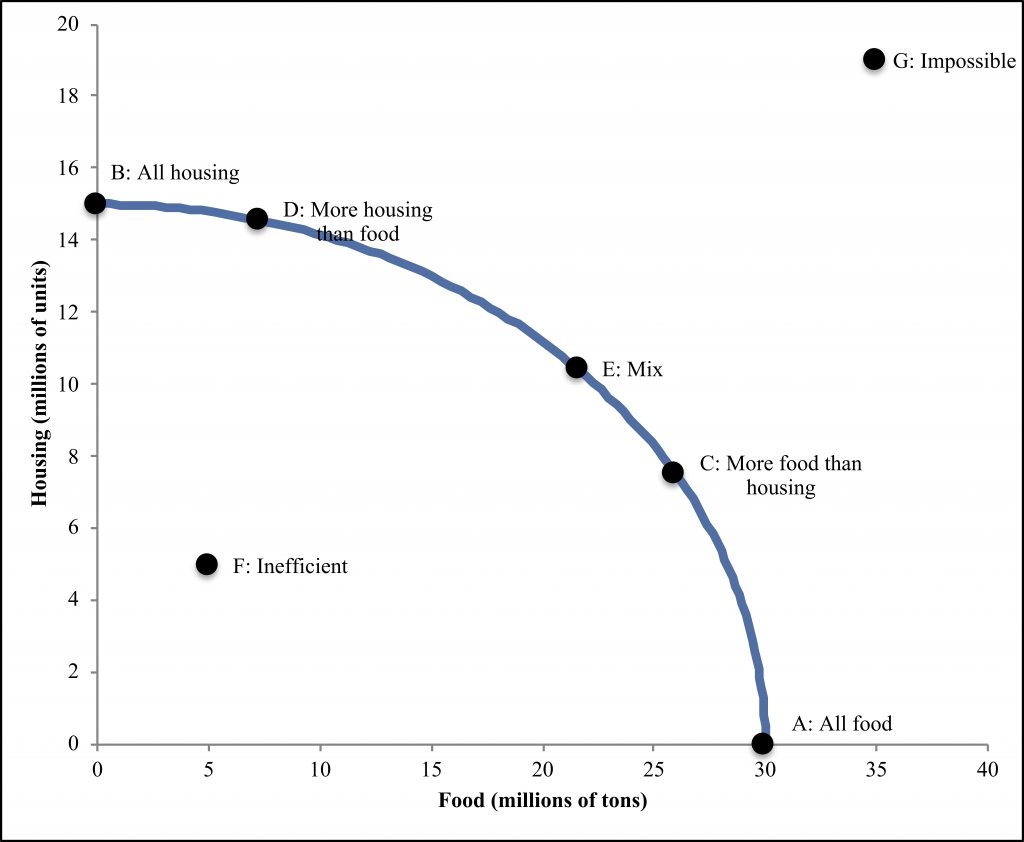
Point E illustrates an important feature: the production possibilities frontier is curved. We can have more of a mix of goods (31.9 million goods total) than just one alone (15 million housing units or 30 million tons of food). This is because inputs tend to be specialized. Specialization means that an input is better suited for producing one output, such as food, than another, such as housing. For labor, this would mean that a carpenter is much better at producing housing than food. If we want to produce all food, that means our carpenter will be farming—and she will not produce very much. Likewise, physical inputs are specialized. Yemen’s resources of seeds will not produce much housing. Some inputs may be quite useful for both goals—land would be useful for both housing and producing food, although the quality of the land might mean some land, for instance with good soil, is better for food, while other land, for instance with sandy soil, is better for housing.
Point F, which is not on the curve, (5 million of each good) is inefficient; we could increase both food and housing at the same time. We are not using all of our resources at point F; that is why it is inefficient. Point G, 19 million housing units and 35 million tons of food, is currently impossible (not feasible). With our current resources we cannot produce so much housing and food.
So how does Yemen decide what to produce, given its current resources? It depends on tradeoffs and people’s preferences. Perhaps it is currently at point E, producing a mix of 21.6 million tons of food and 10.4 million housing units. If Yemen wants to move to point C, which has more food (26.0 million tons), to gain that additional 4.4 million tons of food and reduce hunger, it will have to give up 3.1 million housing units (go from 10.4 million to 7.3 million). This tradeoff is referred to in economics as the opportunity cost. It is not a dollar cost Yemen has to pay, but the opportunities (for housing) that Yemen has to give up to get more food. The opportunity cost, at point E, for 4.4 million tons of food is 3.1 million housing units.
In this example, we’ve been thinking on a large, national scale, and in terms of changes in the millions. A similar principle applies to busy college students facing time constraints during finals. One more hour spent studying for economics means one less hour writing your political science paper. You have a finite amount of resources, including time. The opportunity cost of gaining ten more points on your economics final may be one less page in your political science paper. These decisions about one page or one hour show another aspect common to economics thinking: thinking at the margin. Although it can be helpful to think about what it would take to get to 4.4 million tons more food, most decisions are made like those of the student during finals, thinking about tradeoffs in terms of one more hour. This “one more” thinking is referred to in economics as thinking on the margin. Thinking on the margin refers to thinking about what one additional hour of paper-writing costs, or one additional ton of food takes.
Producing more food in the long run
The production possibilities frontier is a model for what we can produce right now, in the short run, given our current resources and technology. We can also use this model to think about the long run. In the long run, our whole production possibilities frontier can shift. In the long run, producers (countries, firms, or family farms) can change their inputs and their technology. When these changes in inputs and technology lead to more production being possible, that means the economy is growing. When these changes in inputs and technology lead to less production being possible, that means the economy is shrinking.
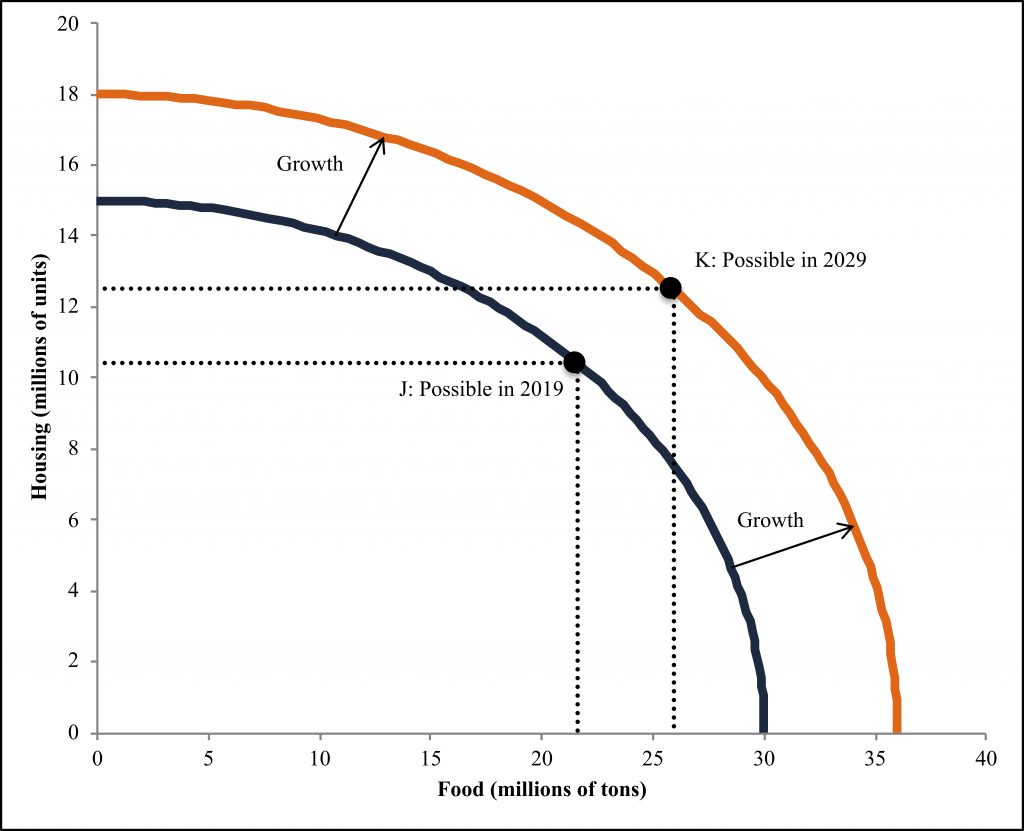
Figure 1.2 shows the economy growing over time. Point J and its frontier were the maximum production options possible in 2019. However, by 2029 point K and its frontier are the most possible, because of better technology and inputs. While point J was 21.6 million tons of food and 10.4 million units of housing, point K is 25.9 million tons of food and 12.5 million units of housing—more of both. Point K was not feasible (possible) in 2019; in 2029 it is now feasible. The shift from the production possibilities frontier with point J to the production possibilities frontier with point K represents economic growth. The key difference between the short run and the long run is that, while in the short run a country can only move along the production possibilities frontier, in the long run it can change the production possibilities frontier, shifting it outward (growing the economy) or inward (shrinking the economy).
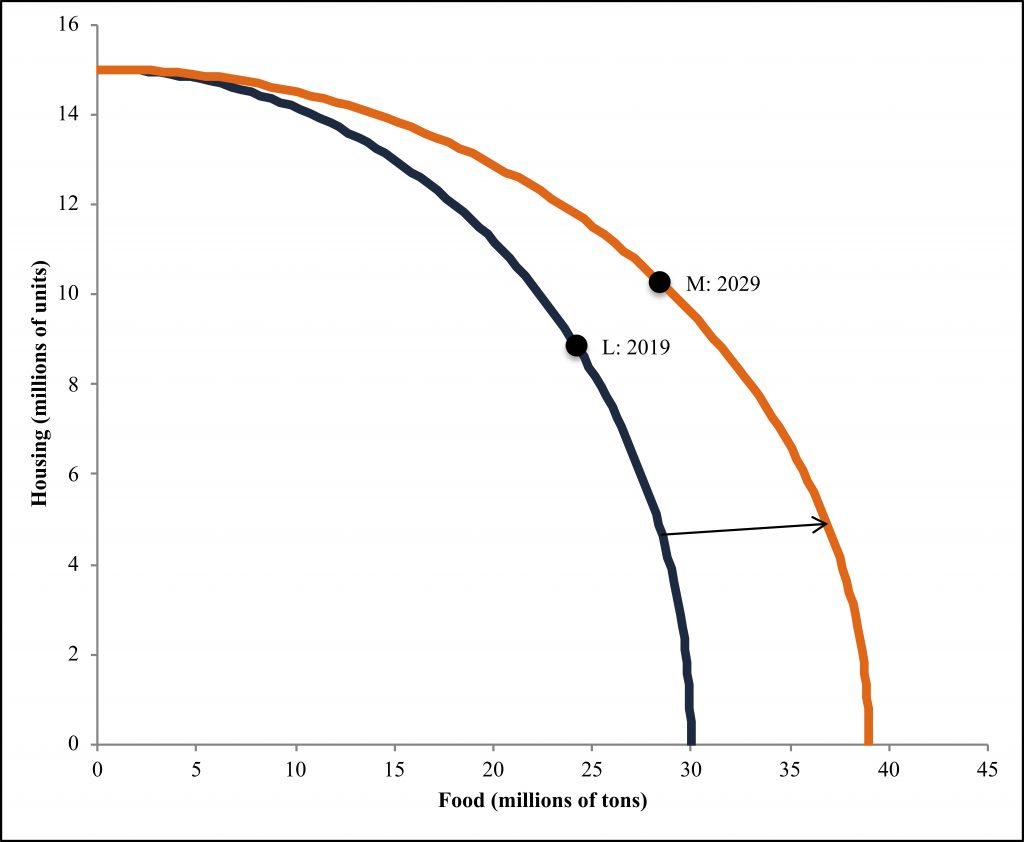
In the long-run, growth may occur more in some outputs than others. For example, a house requires a relatively fixed amount of land, so there may not be much growth in the production possibilities for housing over time if there is a limited amount of land inputs in the country. However, improvements in agricultural technology have allowed farmers to have increased yields (output of food) from the same amount of land. When there’s growth in the long-run in one product (but not so much in the other) this is referred to as specific growth, as opposed to general growth. Figure 1.2 showed general growth, increases in the PPF for both food and housing. Figure 1.3, in contrast, shows a case of food-specific growth; more food is possible than used to be the case. Even though the maximum amount of housing is the same, it may be the case that more housing is produced nonetheless, because some resources (such as land) are shifted from food to housing as agriculture becomes more productive. This is visible in the shift from point L (24.3 million tons of food and 8.8 million housing units) in 2019 to point M (28.5 million tons of food and 10.2 million housing units) in 2029. Both food and housing increased, food relatively more so as a result of food-specific growth.
What can we do to stimulate growth and produce more food? Policies to promote growth depend on the same factors that determine production in the short run: quantity of labor, quality of labor (human capital), physical capital, and technology. While these were fixed in the short run, in the long run they can be changed. When these inputs grow in number or quality, they lead to economic growth. When these inputs decrease in number or quality (for example, a town’s production shrinking because it has fewer and fewer people), the economy shrinks.
In terms of the quantity of labor, countries facing shortages of labor can either encourage immigration or try to encourage increases in the birth rate. An example of this would be generous parental leave or child care policies.[14] Improving human capital requires upgrading the health, skills, or knowledge of the workforce. There are a variety of different ways to increase skills; increasing education is one that we will examine in more detail in a later chapter. Encouraging apprenticeships, which lead to job-relevant skills, can lead to increases in human capital that pay off economically.[15]
Improving physical capital can be challenging. Physical capital, whether a sewing machine, new factory, or new road, tends to be a large and expensive investment, requiring savings. We further explore savings in later chapters. Infrastructure investments, such as roads, are one example of an investment in physical capital that can increase production. A study in Nepal demonstrated that expanding roads in rural areas would substantially improve agricultural production, particularly benefiting the rural poor.[16] Another challenge with infrastructure investments is that they are typically publicly available and used by a large number of people, making them difficult to finance, an issue we return to in later chapters.
Technology has played a particularly critical role in improving well-being over time, including reducing hunger. For example, the “green revolution” in Asia, driven by the introduction of new varieties of wheat and rice in the 1960s and 1970s (new technology), led to large increases in agricultural production which raised farmer’s incomes and well-being substantially.[17] Other examples of technologies that substantially improved productivity and thus human well-being include the discovery of antibiotics, the invention of the computer, the industrial revolution, and the creation of assembly lines.
Technology is important—but how can we increase our level of technology and thus production? Research and development (R & D) is typically required for intentionally improving technology. The future of technology is very uncertain and difficult to predict, which makes R & D investment challenging and time-consuming. For example, University of Minnesota fruit breeders started work on a new apple variety for Minnesota in the 1990s that only became commercially available in 2018.[18] A further challenge is that once something is invented, it is typically available to everyone, unless individuals or firms are given exclusive legal rights (such as patents). The broad availability of technology reduces the motivation of individuals or firms to invest in R & D.
Even when seemingly great technology ideas are developed, they may not work well in real life. Box 1 illustrated the challenge of agricultural technology adoption—using new technologies once they are invented. Adoption also depends on the quality of the new technology. In India, cxv rely on traditional stoves that burn firewood, dung, or agricultural waste. In laboratory conditions, improved cookstoves were shown to reduce indoor air pollution—which is the leading cause of environmental deaths globally.[19] This technology can particularly benefit women, who are disproportionately responsible for cooking. In development economics, there was a lot of optimism about how this technology could contribute to well-being. In real world conditions, however, the stoves broke, were difficult to maintain, and were costlier to households. Households stopped using them and there were no health improvements. This is just one illustration of the challenges of getting seemingly promising technology ideas to actually work in the real world in order to enhance wellbeing. Returning to our hybrid seeds example, one of the reasons that farmers may not adopt hybrid seeds is that the real-world quality of such inputs is low. For example, in Uganda, less than half of hybrid maize is authentic (more than half if fake), and thus, generates lower yields.[20] Developing technologies to increase growth is not an easy process.
Who gets the food?
The PPF is a very useful model for thinking about how to increase production. It can be applied to questions such as increasing food or housing, education or health care, and manufacturing or services. So far, we’ve been primarily focusing on production at a national level—but also noting examples of how the same model might apply to an individual, family farm, or corporation. Since the PPF is a model that simplifies our economy, one issue missing from the model is the allocation of production—who gets the food. The world actually produces enough food to feed everyone and eradicate hunger.[21] The problem of hunger is a problem not just of production, but also of distribution, who gets the food.
Why do certain families or countries experience hunger and others do not? The challenge is that food is produced locally—different people own different amounts of inputs, such as land and labor, and therefore different amounts of resulting food. There are inequalities not only between nations in terms of allocation—a family in Yemen is more likely to be hungry than a family in the United States—but also within countries and even within households. For example, research in Burkina Faso has shown that, even within the same household, women’s farm plots receive fewer inputs and produce less, contributing to inequality within households.[22] In this section, we discuss global economic systems that determine the allocation of resources and ultimately production.
Economic systems
Economic systems are determined on a national level and can take a variety of different forms. The two endpoints for the spectrum of economic systems are a command economy or a market economy. When individuals (or firms) own resources and their output, a country is operating under a market economy, also known as a capitalist economy. A market economy gives individuals (and firms) private ownership of resources, referred to as private property rights. Decisions about what to produce are determined by individuals and firms—decision making is decentralized and coordinated through markets (a concept we will return to in the next chapter). Governments have no role in this system, or only enforce private property rights. A command economy involves collective, government ownership of resources, and is also known as a communist or planned economy. Resource and production decisions are planned and made by the command of the central government.
Note that market economies and command economies are the endpoints of a spectrum of potential economic systems. No country is a pure command economy or a pure market economy. Countries mix elements of these different systems, to varying degrees. Their prevalence globally has also changed substantially over time. For example, in 1917, what would become the Soviet Union was formed as a result of the Russian revolution and represented a shift from a market to planned economy. In 1991, the Soviet Union dissolved, and began a shift towards a more market-based system.[23] China likewise shifted to a command economy in the mid-20th century but has, since 1978, undertaken a series of market-oriented reforms.[24] The countries, including the Soviet Union and China, that were the closest to command economies were intensively planned. For instance, countries had five-year plans for what should be produced, and how the benefits of that production would be shared.
There are substantial tradeoffs in countries’ decisions around economic systems. A central tension in economics, and particularly economic systems, is the tradeoff that often occurs between equity and efficiency. Market economies tend to be more efficient and lead to more growth (there are a number of exceptions that we will discuss in subsequent chapters), while command economies tend to be more equitable. China’s “Great Leap Forward” reforms starting in 1958 illustrate this tension. China shifted to a much more equitable but less efficient economic model, organizing rural communities into large-scale communes. The resulting loss in efficiency in production lead to the deaths of approximately 23 million people.[25] However, inequality may also reduce growth, as illustrated in Box 1.2. The relationships and tradeoffs between equity and efficiency are complex and hotly debated in economics.
Nancy Birdsall is an economist who has worked at international aid organizations, including the Inter-American Development Bank, the World Bank, and the Carnegie Endowment for International Peace. She was the founding president of the Center for Global Development, which “work[s] to change the policies and practices of rich countries and powerful institutions to reduce global poverty and inequality.”
One important area of Nancy Birdsall’s research has been on the relationship between inequality and growth. Economics typically emphasizes a tradeoff between growth and equity. Birdsall demonstrated that policies that reduce poverty and inequality, such as education, can also increase growth. She demonstrated that low inequality in East Asia contributed to the region’s rapid growth from 1960-1985.
The main reason market economies can be more efficient and lead to more growth than command economies is that the private property rights of market economies create important incentives (motivations). When individuals own resources and the output of those resources, it creates an incentive to be more efficient or work harder. Additional effort and investment on the family farm leads to more food for the family under a market economy. In a command economy, investment and effort by the family will not change how much food they receive. An example of the consequences of poor incentives is that, in China, when family farms had less ownership of land, they were less likely to invest in their land, lowering production.[27]
Although there are often tradeoffs in terms of equity and efficiency in economic systems, economics can also help us identify ways to enhance both equity and efficiency (or growth). For example, investing in early childhood education (a form of human capital) has been identified as one of the world’s best investments by economists.[28] It has also been identified by economists as the most effective education policy for reducing inequality.[29] The importance of early childhood education for both efficiency and equity is why a number of countries that have a larger government role in the economy (a shift towards the command economy side of the spectrum), such as Norway, invest public funds heavily in early childhood education.[30]
Measuring our output
So far, we have been focusing on a two-good world in our production possibilities frontier model. However, in real life, there are not just two goods. How can we measure production with many goods? Economists measure output with the gross domestic product (GDP), which is the market value of all final goods and services produced in a country over a specific time period. Market prices are used to calculate GDP based on what is produced. So, if a (very small) country produced five apples, priced at $2 each, two pears, priced at $3 each, and four bananas, priced at $1 each, its GDP would be $20 ($20=5*$2 2*$3 4*$1). Typically, GDP is an annual (year) measurement, but many countries also produce quarterly or monthly estimates of GDP.
GDP can measure the level of a nation’s production in current prices. When current prices are used to calculate GDP, this is referred to as nominal GDP. Nominal GDP could change over time due to prices rising, even if the country is producing the exact same amount of products. When prices increase for the same good or service, this is referred to as inflation. Economists measure changes in prices in order to know if a country is really producing more or not. When accounting for inflation, economists use price indices, measures of prices, such as the Consumer Price Index (CPI) to adjust GDP. GDP that has been corrected for inflation using a price index is referred to as real GDP, measuring the real (not just price) changes in production. Real GDP tells us whether a country is actually producing more.
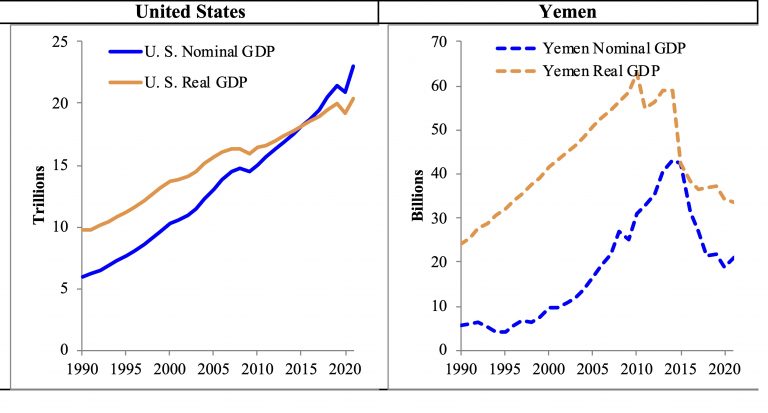
Figure 1.4[31] shows real and nominal GDP in the United States and Yemen over time. Note that GDP for the United States is in trillions, and thus almost 1,000 times larger than that of Yemen, in billions. Real and nominal GDP have both been rising over time in the United States, with a dip around 2009 due to the Great Recession and another dip in 2020 with the COVID-19 pandemic. Nominal GDP has been rising faster than real GDP because prices have been rising over time; the two are the same in 2015, which was the base year used for prices in this case. Yemen had likewise been experiencing both nominal and real GDP growth until 2010. At that point, nominal GDP continued to rise quite rapidly because of rising prices, but real GDP fell, meaning fewer actual goods and services were being produced. Both real and nominal GDP began falling in Yemen starting in 2015, due to the ongoing war. The war has killed a quarter of a million people, destroyed housing and infrastructure, disrupted services, and pushed the country closer to famine.[32]
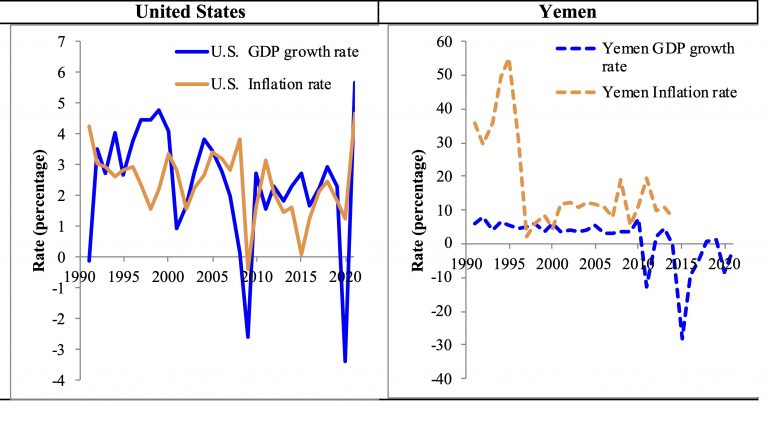
Two of the most important, headline-grabbing measures of the economy are the GDP growth rate and the inflation rate. These rates measure how much production is changing, which determines what a country can possibly consume, and how much prices are changing. While Figure 1.4 showed the level of output and prices, Figure 1.5[33] shows how they have changed over time. The (real) GDP growth rate shows how much production has expanded or, as in 2009 and 2020, contracted in the United States. The volatility of GDP growth is referred to as the business cycle, reflecting short run fluctuations. In the U.S., real GDP growth in the long run has tended to be between 2% and 4%. Prices have usually increased between 1% and 3% through 2020, but then inflation rose rapidly in 2021, due in part to supply chain disruptions caused by the pandemic. In contrast, Yemen has experienced much more volatile production and prices, with the real GDP growth rate ranging from a high of 8% to a low of -28%. Inflation has likewise varied from a 55% annual increase in prices down to as low as 2%. These fluctuations represent profound changes in the ability of the country to produce food or other goods, as well as for consumers to afford the prices of different goods, including food.
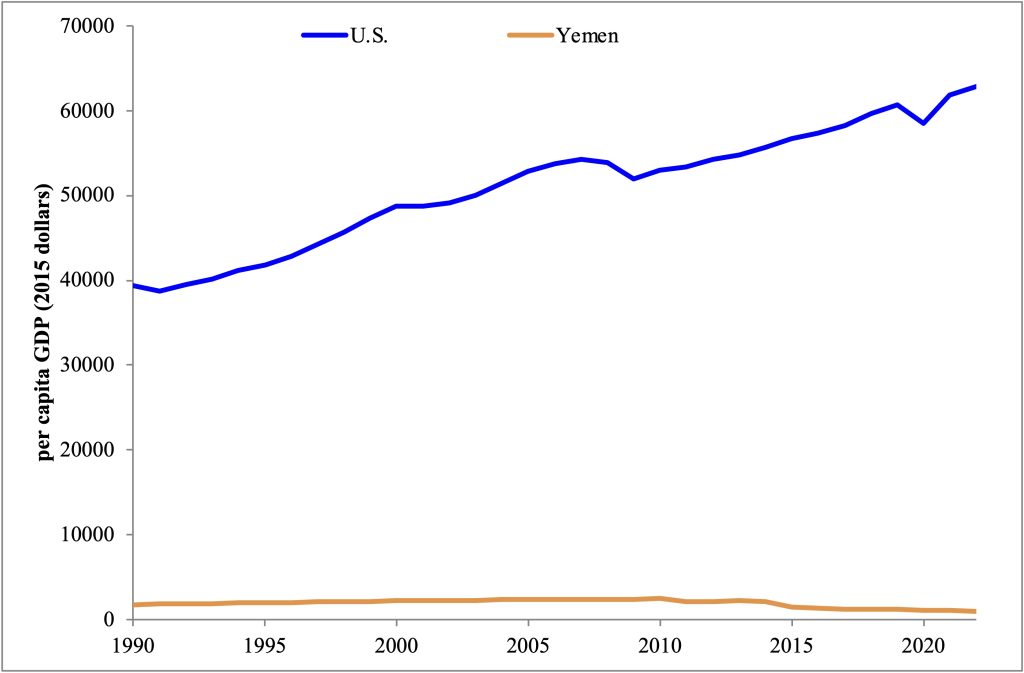
Another important factor to consider with GDP is how many people are in a country. When we divide the production of the country by its population, we calculate per capita GDP (per capita means per person). Per capita GDP can be in real or nominal terms. Although per capita GDP does not account for inequalities and is just an average, it is still a helpful starting point for considering a country’s resources and production. Figure 1.6[34] illustrates this point with real per capita GDP for the United States and Yemen. As of 2022, real GDP per capita was $62,867 in the United States and $1,018 in Yemen. While real GDP per capita in the United States increased over time, with a dip during the Great Recession and pandemic, real GDP per capita has risen and fallen in Yemen. It reached a high of $2,547 per capita in 2010 before falling to less than half of that level by 2022. Already starting from a low level, this means that the country has, on average, less than half as much production to meet the basic needs of its citizens.
Measuring poverty
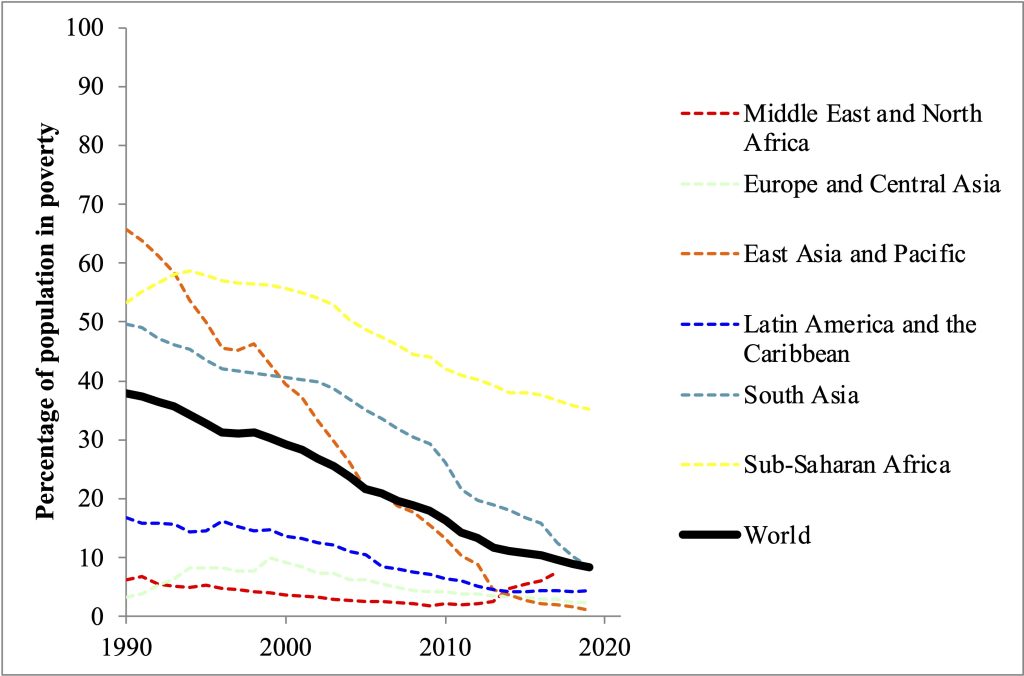
There are enormous disparities in the average level of production available to support the needs of Americans and Yemenis. Yet both countries have problems with hunger (although to varying degrees). This is because of inequality within countries and insufficient resources available to certain individuals and households. There are a variety of ways to measure poverty, when people do not have enough resources to meet their basic needs. In a later chapter, we examine poverty in the United States, and anti-poverty policies, including anti-hunger programs, in detail. For now, we will look at one measure of poverty—the percentage of people living on less than $2.15 per day. Taking into account price differences across country, this is considered a measure of extreme poverty. The good news is that extreme poverty has decreased over time in every single region of the globe (Figure 1.7[35]). Despite a rising global population, there are fewer people living in extreme poverty than there were 20 years ago.[36] Although we have not solved world hunger, and no region or country has zero poverty, we have, globally, made major progress.
Conclusions
There is reason to hope that we can end hunger. The world already produces enough food to feed everyone.[37] This production is, however, unequally distributed across countries and across households and individuals within countries. Differences in technology, physical and human capital and labor across countries are a key driver of international inequality. These differences arise for a variety of complex forces, ranging from the impact of colonialism to differences in physical climate.[38]
Global development goals (such as the Sustainable Development Goals) include eradicating hunger. Global organizations such as the World Food Program (WFP), United Nations (UN), World Bank, Food and Agriculture Organization (FAO), and International Fund for Agricultural Development (IFAD) work to reduce hunger. They provide a variety of short run help (humanitarian aid). They also provide grants, loans, and technical assistance (advice) to allow for investments in human and physical capital and technology that can increase production and reduce hunger in the long-run. Funded by wealthier countries, these agencies have helped (but not solved) the problem of world hunger; WFP has already cut back the food aid it is giving Yemen due to insufficient funding.[39]
Although private property and other aspects of market economies create incentives that can spur growth, who owns property (or other forms of wealth) and who receives investments matters. Property ownership and investments are unequally distributed within countries. We will return to this point in the chapter on discrimination. Despite the challenges of inequality, we have seen global progress in reducing hunger and poverty. Investments in different aspects of production—labor, human capital, physical capital, and technology—have all contributed to increases in production. Families can produce more food by investing in these areas. Depending on the role they choose for government, countries can reduce inequality or spur growth through public policies that encourage or create investments in these areas. One day, these investments may be enough to end hunger.
List of terms
- Economics
- Microeconomics
- Macroeconomics
- Labor
- Human Capital
- Physical Capital
- Technology
- Long run
- Short run
- Production Possibilities Frontier
- Specialization
- Opportunity cost
- Margin
- Research and development (R&D)
- Command economy
- Market economy
- Gross Domestic Product (GDP)
- Nominal
- Inflation
- Price index
- Real
- Per capita
- Poverty
References
Alene, Arega D., Abebe Menkir, S.O. Ajala, B. Badu-Apraku, A. S. Olanrewaju, V. M. Manyong, and Abdou Ndiaye. 2009. “The Economic and Poverty Impacts of Maize Research in West and Central Africa.” Agricultural Economics 40: 535–550.
Birdsall, Nancy, David Ross, and Richard Sabot. 1995. “Inequality and Growth Reconsidered: Lessons from East Asia.” The World Bank Economic Review 9 (3): 477–508.
Bold, Tessa, Kayuki C. Kaizzi, Jakob Svensson, and David Yanagizawa-Drott. 2017. “Lemon Technologies and Adoption: Measurement, Theory, and Evidence from Agricultural Markets in Uganda.” Quarterly Journal of Economics 132 (3): 1055–1100.
Center for Global Development. 2017. “About CGD.” Retrieved August 7, 2017. https://www.cgdev.org/page/about-cgd.
Checchi, Daniele, and Herman G. van de Werfhorst. 2014. “Educational Policies and Income Inequality.” IZA Discussion Paper Series No. 8222. Bonn, Germany.
Coleman-Jensen, Alisha, Matthew P. Rabbitt, Christian A. Gregory, and Anita Singh. 2022. “Household Food Security in the United States in 2020.” U.S. Department of Agriculture, Economic Research Service.
———. 2021b. “Statistical Supplement to Household Food Security in the United States in 2021.” U.S. Department of Agriculture, Economic Research Service.
Cotti, Chad, John Gordanier, and Orgul Ozturk. 2018. “When Does It Count? The Timing of Food Stamp Receipt and Educational Performance.” Economics of Education Review 66: 40–50.
Dewey, Kathryn G., and Khadija Begum. 2011. “Long-Term Consequences of Stunting in Early Life.” Maternal & Child Nutrition 7: 5–18.
Dion, Patrice, Eric Caron-Malenfant, Chantal Grondin, and Dominic Grenier. 2015. “Long-Term Contribution of Immigration to Population Renewal in Canada: A Simulation.” Population and Development Review 41 (1): 109–126.
Drange, Nina, and Tarjei Havnes. 2015. “Child Care Before Age Two and the Development of Language and Numeracy: Evidence from a Lottery.” IZA Discussion Paper Series No. 8904.
El-Kogali, Safaa, and Caroline Krafft. 2015. Expanding Opportunities for the Next Generation: Early Childhood Development in the Middle East and North Africa. Washington, DC: World Bank.
Foster, Andrew D., and Mark R. Rosenzweig. 1996. “Technical Change and Human-Capital Returns and Investments: Evidence from the Green Revolution.” The American Economic Review 86 (4): 931–953.
Gilbert, Natasha, Virginia Gewin, Jeff Tollefson, Jeffrey Sachs, and Ingo Potrykus. 2010. “How to Feed a Hungry World.” Nature 466 (7306): 531–532.
Hanna, Rema, Esther Duflo, and Michael Greenstone. 2016. “Up in Smoke: The Influence of Household Behavior on the Long-Run Impact of Improved Cooking Stoves.” American Economic Journal: Economic Policy 8 (1): 80–114.
Hasell, Joe, Max Roser, Esteban Ortiz-Ospina, and Pablo Arriagada. 2023. “Poverty.” Our World in Data. Retrieved August 24, 2023. https://ourworldindata.org/poverty.
Hoddinott, John, John A. Maluccio, Jere R. Behrman, Rafael Flores, and Reynaldo Martorell. 2008. “Effect of a Nutrition Intervention during Early Childhood on Productivity in Guatemalan Adults.” Lancet 371 (9610): 411–6.
Jacoby, Hanan G. 2000. “Access to Markets and the Benefits of Rural Roads.” The Economic Journal 110 (465): 713–737.
Jacoby, Hanan G., Guo Li, and Scott Rozelle. 2002. “Hazards of Expropriation: Tenure Insecurity and Investment in Rural China.” American Economic Review 92 (5): 1420–1447.
Johnson, Marianne, and Alexander Kovzik. 2016. “Teaching Comparative Economic Systems 25 Years after the Collapse of the Soviet Union.” International Review of Economics Education 22: 23–33.
Krafft, Caroline. 2018. “Is School the Best Route to Skills? Returns to Vocational School and Vocational Skills in Egypt.” The Journal of Development Studies 54 (7): 1100–1120.
Moyer, Jonathan D., David Bohl, Taylor Hanna, Brendan R. Mapes, and Mickey R. 2019. “Assessing the Impact of War on Development in Yemen.” UNDP and Fredrick S. Pardee Center for International Futures.
Peng, Xizhe. 1987. “Demographic Consequences of the Great Leap Forward in China’s Provinces.” Population and Development Review 13 (4): 639–670.
Rønsen, Marit. 2004. “Fertility and Family Policy in Norway – A Reflection on Trends and Possible Connections.” Demographic Research 10: 265–286.
Roser, Max, and Esteban Ortiz-Ospina. 2013. “Global Extreme Poverty.” Retrieved August 27, 2022. https://ourworldindata.org/extreme-poverty/.
Sala-i-Martin, Xavier, Gernot Doppelhofer, and Ronald I. Miller. 2004. “Determinants of Long-Term Growth: A Bayesian Averaging of Classical Estimates (BACE) Approach.” The American Economic Review 94 (4): 813–835.
Shrestha, Rajendra B ., and Chennat Gopalakrishnan. 1993. “Adoption and Diffusion of Drip Irrigation Technology: An Econometric Analysis.” Economic Development and Cultural Change 41 (2): 407–418.
Suri, Tavneet. 2011. “Selection and Comparative Advantage in Technology Adoption.” Econometrica 79 (1): 159–209.
Temple, Judy A., and Arthur J. Reynolds. 2007. “Benefits and Costs of Investments in Preschool Education: Evidence from the Child–Parent Centers and Related Programs.” Economics of Education Review 26 (1): 126–144.
Udry, Christopher. 1996. “Gender, Agricultural Production, and the Theory of the Household.” Journal of Political Economy 104 (5): 1010–1046.
University of Minnesota. 2018. “UMN Plant Breeders Introduce First Kiss Apple.” Retrieved December 6, 2019. https://twin-cities.umn.edu/news-events/umn-plant-breeders-introduce-first-kiss-apple.
World Bank. 2007. “World Development Report 2008: Agricutlure for Development.” Washington, DC: World Bank.
———. 2022. “World Development Indicators.” Retrieved August 27, 2022. www.databank.worldbank.org.
———. 2023. “World Development Indicators.” Databank.
World Food Programme. 2017. “Yemen Facts and Figures.”
———. 2023. “WFP Yemen Situation Report # 7 July 2023.”
Yining, Li. 2012. Economic Reform and Development in China. Cambridge: Cambridge University Press.
- As of July 2023. World Food Programme 2023 ↵
- World Food Programme 2017 ↵
- El-Kogali and Krafft 2015 ↵
- Dewey and Begum 2011 ↵
- Moyer et al. 2019 ↵
- As of 2021. Coleman-Jensen et al. 2022 ↵
- As of 2021. Coleman-Jensen et al. 2022 ↵
- Cotti, Gordanier, and Ozturk 2018 ↵
- Hoddinott et al. 2008 ↵
- Alene et al. 2009 ↵
- Shrestha and Gopalakrishnan 1993 ↵
- Suri 2011 ↵
- Foster and Rosenzweig 1996 ↵
- Dion et al. 2015; Rønsen 2004 ↵
- Krafft 2018 ↵
- Jacoby 2000 ↵
- World Bank 2007 ↵
- University of Minnesota 2018 ↵
- Hanna, Duflo, and Greenstone 2016 ↵
- Bold et al. 2017 ↵
- Gilbert et al. 2010 ↵
- Udry 1996 ↵
- Johnson and Kovzik 2016 ↵
- Yining 2012 ↵
- Peng 1987 ↵
- Birdsall, Ross, and Sabot 1995; Center for Global Development 2017 ↵
- Jacoby, Li, and Rozelle 2002 ↵
- Temple and Reynolds 2007 ↵
- Checchi and van de Werfhorst 2014 ↵
- Drange and Havnes 2015 ↵
- World Bank 2022 ↵
- Moyer et al. 2019 ↵
- World Bank 2022 ↵
- World Bank 2023 ↵
- Hasell et al. 2023 ↵
- Roser and Ortiz-Ospina 2013 ↵
- Gilbert et al. 2010 ↵
- Sala-i-Martin, Doppelhofer, and Miller 2004 ↵
- World Food Programme 2023 ↵
