
10 The Economics of Social Safety Nets: Here to Catch Us When We Fall?
Caroline Krafft
What are Social Safety Nets?
What happens if you lose your job? Will you have enough money to retire one day? How do governments support our health and old age? This chapter answers these important questions about the social safety net, the supports that people can rely on should they get sick, become disabled, or lose their job. The social safety net goes by different names. Sometimes it is referred to as social protection or social insurance. There are a variety of different programs that are part of the social safety net in different countries, often with confusing names. For example, in the United States we have Medicare, which provides health insurance to seniors, and Medicaid, which provides health insurance to low-income families. All the policies we discussed in the poverty chapter are part of the social safety net as well.
In this chapter we will focus on the insurance aspects of the social safety net. Private insurance programs are when you make a regular payment, called a premium, to a private company. In return, you receive a benefit if some (usually bad) event occurs in the future. For example, you may pay renter’s insurance. If the pipes leak on to your computer in your apartment, renter’s insurance will pay out a benefit to repair or replace your computer. Most private insurance is voluntary—you can choose whether or not to get it—although there are exceptions. You are required by the government to have car insurance in the United States. Banks will only lend for a home mortgage if you have homeowner’s insurance. Although these forms of insurance may be mandatory, they are still private insurance because you are paying a private firm the premium.
Social insurance programs require paying a premium to the government rather than a private company. The premium is often a contribution from your paycheck if you are working. For example, in the United States, 6.2% of each paycheck goes towards Social Security, the program that supports seniors in their old age.[1] Employers pay an equivalent amount as well. In Egypt, workers contribute 14% of their base pay towards social insurance for old age,[2] similar to social security in the United States.
Social insurance programs may overlap with private insurance programs. For example, there are both private ways to save for retirement, through retirement savings accounts, and social insurance programs such as Social Security. There are also social safety net programs that pay out based on need rather than contribution. For example, while Medicare is funded by contributions of workers before they reach old age, Medicaid helps low-income families based on their income and is funded primarily by tax dollars from society overall.
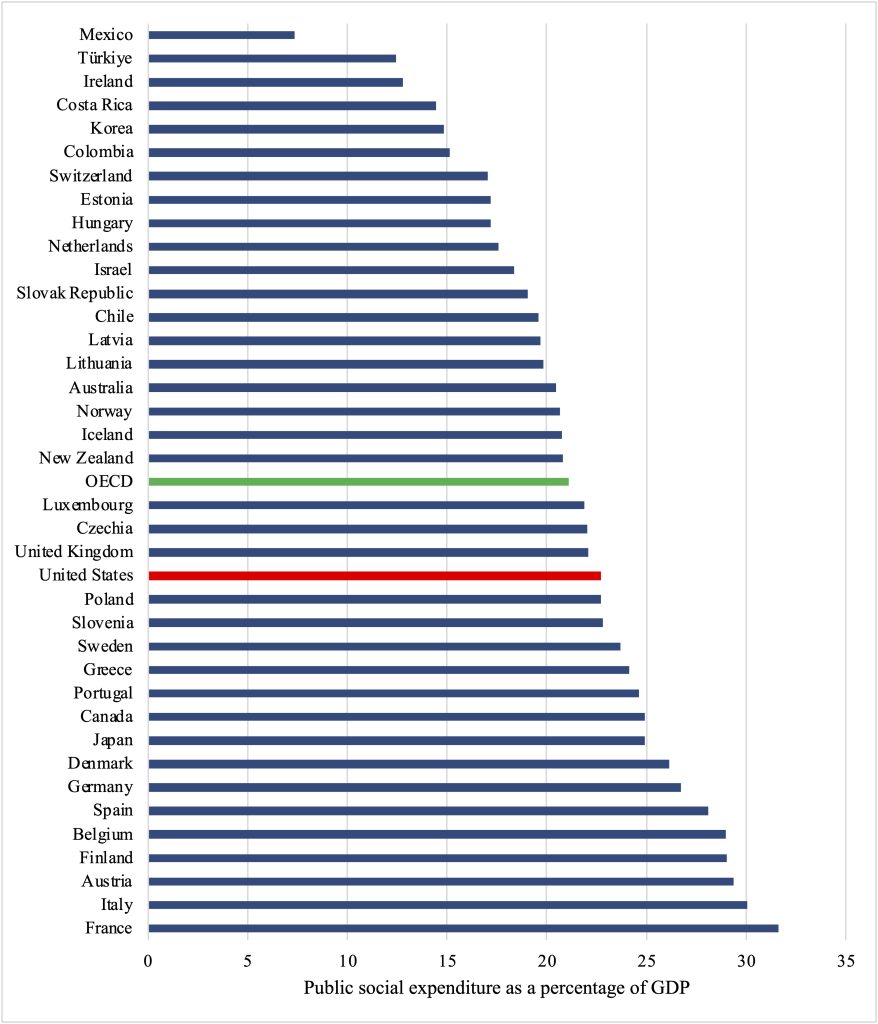
Countries also vary in how extensive the social safety net is. Some countries have broad and generous social safety net programs while others rely primarily on the private sector or individuals to take care of old age, insurance, or health care. Figure 10.1[3] shows public social expenditure[4] as a percentage of GDP in Organization for Economic Co-operation and Development (OECD) countries. Spending, as a percentage of GDP varies widely, from low levels such as 7% in Mexico and 12% in Türkiye to highs of 30% in Italy 32% in France. The OECD average is 21%. Spending levels in the United States are similar – 22% – to the average and other countries such as the United Kingdom (also 22%).
An important purpose of this chapter is understanding why there may be government involvement in certain sectors—why is the safety net a social undertaking? The chapter specifically examines two major social insurance topics. First, we examine the case of Social Security and saving for old age in the United States. Then we study the issue of unemployment insurance, supporting laid-off workers. Lastly, we examine funding for the social safety net in the context of government spending and debt.
Saving for old age
Private market options
How can people make sure they have enough income for their old age? Individuals may want to retire. For health reasons, it may not even be possible to keep working at a certain point. However, retiring requires having sufficient income to meet your needs in old age. Individuals can save for retirement, for example putting money into a savings account or investing in property. Retirement savings are often in stocks, shares in a company, that pay dividends (regular payouts from the company’s profits). People can also buy bonds, essentially IOUs (for example, a bond to fund Amazon’s takeover of Whole Foods[5]) that generate interest (pay a percentage out every year). Savings accounts may also generate interest, as banks will pay you to keep your money there (so they can loan it out to others and receive even more interest). Another option is an annuity, a fixed sum of money paid every year, bought in either in a lump sum or over time. These options have varying degrees of risk. Different types of bonds may be more or less risky, while stock prices, dividends, and savings interest are highly variable. Annuities are a safer investment, since payouts are fixed, but they may lead to less total income than riskier investments. There are tradeoffs between the degree of risk and the rate of return (how much you receive).
Another way individuals may save for old age is through their workplace. People can often invest in stocks, bonds, and annuities through private firms at their workplace in a way that has special tax status, deferring taxes until funds they are withdrawn. These accounts, often referred to as 401(k)s, have this special tax status and are available from many employers. Alternatively, some firms may provide pensions. Pensions are like annuities—fixed annual payments—that are funded by the firm. Firms build up savings in a pension fund to pay out to retired workers.
Why is the government involved in savings?
All of the options discussed so far are based on private firms and markets providing financial products. Why would the government be involved in these markets at all? Shouldn’t people be allowed to choose how to save for old age? The main reason for government involvement is that people, when left to their own devices, are terrible at saving for old age (or saving for anything else). For example, in the United States only 47% of people report that they have savings or a rainy day fund that could cover three months of expenses.[6] A variety of reasons could account for individuals’ difficulty saving, including information issues and uncertainty. It is hard to know how much you need for retirement or to understand complex financial products that can help with retirement.[7] People are also bad at self-control, tend to procrastinate, and prefer money today to money tomorrow.
Box 10.1. Behavioral economics: Understanding barriers to savings[8]
An important field for understanding savings (as well as health care, discussed last chapter) is behavioral economics. Behavioral economics brings together economics and psychology. The field challenges the assumption of traditional economic theory that individuals have all the information they need and are perfectly rational decision-makers.
Behavioral economics provides insights into why people are bad at savings, and what we can do about it. For example, when employees have to opt-in to their retirement savings (making the default zero) they are less likely to save for retirement than if they had to opt out of savings instead. Although the default should not matter for savers’ decisions, it does, and it matters a lot. In an experiment based on switching workers to automatic enrollment, 86% of employees contributed to a 401(k) plan when enrollment was automatic, but just 49% participated when they actively had to enroll. This insight from behavioral economics has led to more automatic-enrollment plans for savings.
Social Security
Social Security is the United States social insurance program designed to act as a social safety net as people age. The program also helps address the challenges workers face in saving. The United States’ current Social Security program has its roots in the Great Depression.[9] The Social Security Act became law in 1935 as a form of old-age insurance. It provides monthly retirement benefits to individuals 65 and older. It originally covered few workers but expanded substantially over time. Social security is credited with bringing the rate of elderly poverty from 35.2% in 1959 to 10.2% today.[10] The reduction in elderly poverty brought about by social security illustrates some of the arguments for government involvement in saving for old age.
Benefits for social security are based on wages while working.[11] The program was never intended to fully replace other forms of income, as it provides benefits equivalent to 42% of individuals’ previous wages. Dependents (children) and survivors (spouses) of workers who die are eligible for benefits as well. Lower-income earners receive benefits that are a greater share, around 56%, of their earnings, compared to 35% for higher-income earners.[12]
The program uses payroll taxes (taken directly out of workers’ paychecks) to collect workers’ contributions. Workers must contribute 6.2% of their wages. The program has an equal employer share of 6.2%. Wages are taxed up to the first $168,600.[13] Social security taxes are like automatic enrollment in retirement savings – but with no opt-out and a guaranteed benefit.
There are two important economic issues to consider with Social Security. The first is the effect of the program on labor supply. Will people work more or less as a result of having Social Security reduce their present wages but provide a future benefit? The empirical evidence shows that individuals are more likely to retire at the Social Security retirement age, reducing overall labor supply in the United States.[14]
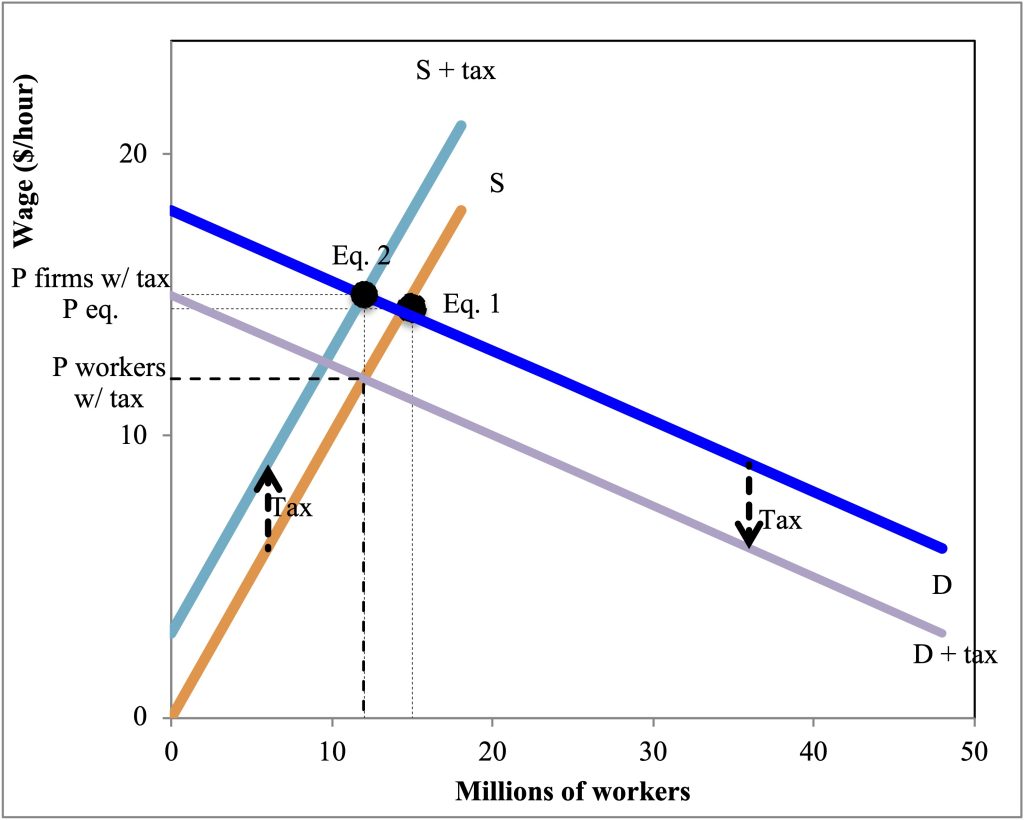
The second question, which we can model with a labor supply and demand diagram, is who actually pays the Social Security tax? The official rule is that employees pay 6.2% and employers pay 6.2%. However, it could be the case that employers increase wages to make up for the loss to Social Security, or that they reduce wages to cover not just the employee but also their payment. This is a question of tax incidence—who, economically, pays the tax.
Figure 10.1 shows a labor market where labor supply is relatively inelastic and labor demand relatively elastic. As with Social Security, each actor must pay an equal tax. Here we have simplified to make the tax a fixed $3 per hour for both the workers and employers. This tax decreases labor supply (you take home less of every dollar) and decreases labor demand (firms have to pay more for their workers). However, although each side on paper has to pay equally, the tax incidence is not equal. Moving from equilibrium 1, without the tax, to equilibrium 2, with the tax, because labor demand is more elastic, the wage that firms pay with the tax has increased only a little. However, because labor supply is relatively inelastic, the wage that workers take home has dropped substantially. Relative to where they started, Peq, firms are paying a little more and workers are making a lot less. Now, if workers receive the reduction back in the form of Social Security, this is not necessarily a problem, especially if it overcomes market failures in savings. However, it does illustrate that who theoretically pays the tax is not the true tax incidence—who is affected the most by the tax.
Unemployment insurance
While social security is a safety net for during old age and retirement, other social insurance programs play an important role while individuals are working. Unemployment insurance provides those who were working – but got laid off – with income that replaces some of their lost wages.[15] Those who quit voluntarily or are looking for their first jobs cannot receive unemployment insurance. Taxes on employers fund unemployment insurance, with benefits varying by state. Typically unemployment insurance replaces 30-50% of lost wages and lasts up to 26 weeks.[16] States may also offer the unemployed help finding new jobs – re-employment services.[17]
Unemployment insurance plays an important role in supporting laid off workers and the economy as a whole, particularly during recessions.[18] The unemployed tend to rapidly spend their benefits (because they are lower than pre-unemployment consumption).[19] For instance, during the Great Recession, unemployment insurance benefit extensions and the consumer spending of the unemployed increased GDP and employment.[20] Unemployment insurance thus can act as economic stimulus during recessions.
Unemployment insurance can also support the wellbeing of laid off workers, for instance it can help laid off workers keep their health insurance and afford health care, improving their health.[21] The main concern with unemployment insurance is that this benefit can reduce job search effort for the unemployed, prolonging or increasing unemployment.[22] However, because of the positive effects of unemployment insurance spending on GDP, research suggests that any potential negative effects on employment rates from reduced job search are canceled out, and the net effect is no change in overall employment.[23]
Government Spending
Social safety nets have an enormous role in government spending in the United States. Figure 10.3 shows the United States federal government budget for the year 2024.[24] States may also collect taxes and have substantial budgets, as do counties and cities. However, when we are thinking about social safety nets and especially social insurance, the federal government is the main player. The figure distinguishes between revenues (money coming in) and spending (money going out). Some of the money being spent is mandatory—it has to be spent based on law. Mandatory spending is also often referred to as an entitlement. Social insurance programs are common entitlements, where an individual pays in during their working years and then is entitled to a benefit.
Where does most of our federal money come from? First, 2.5 trillion dollars comes from individual income taxes. Then 1.7 trillion are from payroll taxes, which are designed to fund social insurance. Corporate income taxes provide 569 billion in revenues, and the remaining 234 billion in revenues is from other sources.
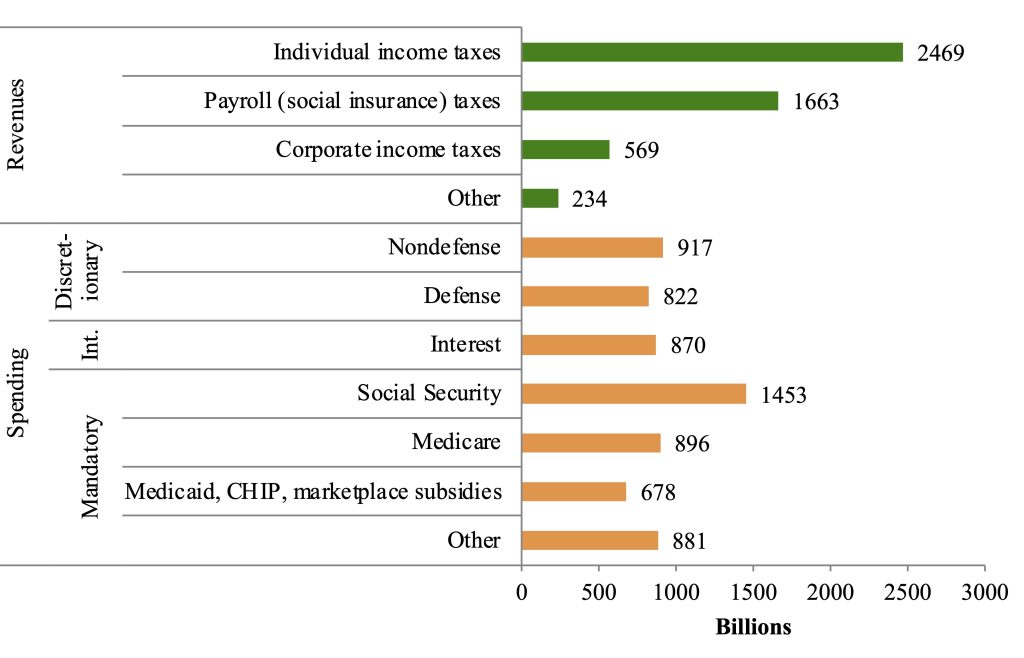
On the spending side, Social Security is the single biggest government expenditure, at 1.5 trillion dollars. Medicare is 896 billion, followed by Medicaid, the Children’s Health Insurance Program (CHIP), and marketplace subsidies at 678 billion. The remaining mandatory programs, such as unemployment insurance, veterans’ benefits, the earned income tax credit, Supplemental Nutrition Assistance Program (SNAP or food stamps), and many others, together total 881 billion. These are the mandatory government expenses. Mandatory spending totals 3.9 trillion dollars compared to 1.7 trillion of discretionary spending. Another important expense is interest on our national debt (870 billion). Discretionary spending is what lawmakers control through specific bills and acts (appropriations). Almost half of discretionary spending is defense (822 billion). The other half of discretionary spending is non-defense (917 billion).
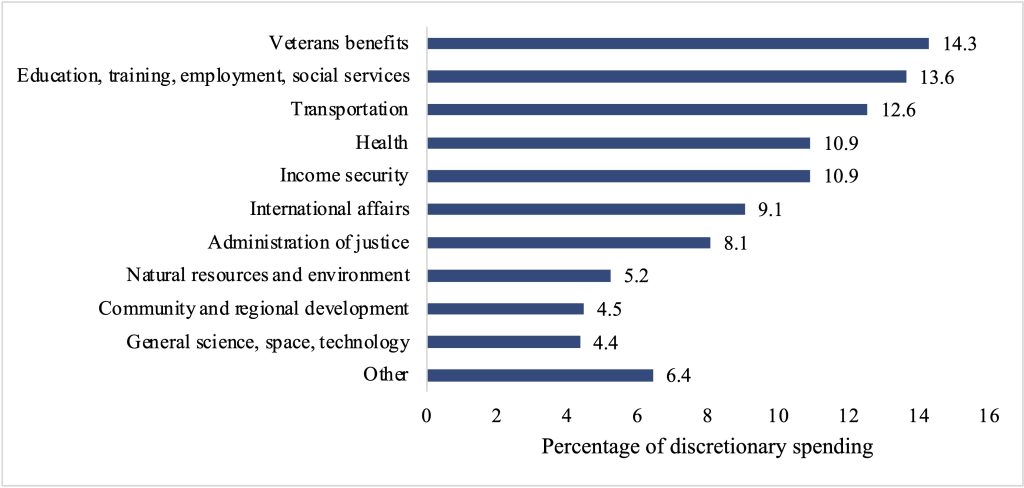
Aside from defense, what does the federal government discretionary budget include? Figure 10.4[25] shows the different categories of non-defense discretionary spending, as a percentage of all non-defense discretionary spending in 2023. Veterans’ benefits were the largest share – 14.3% of non-defense discretionary spending – followed by 13.6% for education, training, employment, and social services. Transportation (12.6%), health (10.9%) and income security (10.9%) were also sizeable shares of discretionary non-defense spending. Categories such as natural resources and the environment (5.2%) had smaller shares of discretionary non-defense spending.
Why do we have to pay interest on our debt? Each year when the budget is set, there may be a budget surplus (revenue > spending) or a budget deficit (revenue < spending). The deficit in 2024 was projected at 1.6 trillion.[26] When there is a deficit, the government will pay for the extra spending by borrowing money from the public through bonds or securities. As deficits and surpluses add up over time, if we end up owing money, this is our debt. As of 2024, public debt[27] was equal to 99% of our GDP—26.2 trillion dollars. In one sense, this is alarming—it is a huge amount of money. However, from another angle, we have debt similar to what our economy produces in a single year.
The real issue is the long-term outlook of our debt, which is poor under current law. Increases in the cost of social insurance programs—especially Medicare and Social Security—are a major problem. If current spending and revenue patterns continue and projected Medicare and Social Security trends play out, debt would reach 166% of GDP by 2054.[28] That could be more problematic than the current situation, as the public holding government debt might start to worry about being paid back, leading to higher interest rates (another expense for the government).
Linked to our debt challenges are challenges paying for Social Security and Medicare. These programs rely on the payments of current workers—which pile up in trust funds—to help fund current benefits. Such a system is referred to as pay-as-you-go. In contrast, a system where individuals’ benefits are funded by their initial contributions would be fully funded. Demographic factors play an important role in pay-as-you-go systems. When populations are young, there are a lot of workers paying in and few people receiving benefits. As populations age—as the baby boomers are doing in the United States—there are many more people with benefits, yet relatively fewer workers paying in.
Currently, the structure of Social Security is unsustainable. The trust fund is projected to run out in 2035.[29] Although concerning, this is a solvable problem. The shortfall in the long run (through 2098) amounts to 4.6% of taxable payroll.[30] Benefits can be reduced; starting in 2035, benefits would have to be reduced by 25%. Alternatively, the age of receiving benefits could be adjusted, or payroll taxes changed. For instance, taxing earnings over $250,000 would keep social security solvent through 2046.[31] Removing this earnings cap and taxing investment and business income would keep the trust fund solvent until almost 2100.[32]
Summary and Conclusions
Safety nets are critical to ensuring that citizens are secure in their retirement or when they experience a shock, such as job loss. Although individuals can save for old age or a rainy day on the private market, a number of challenges and market failures make the performance of the private market on its own problematic. Therefore, governments build social safety net programs. Social insurance programs, where individuals contribute from payroll taxes, were the particular focus of this chapter. Social Security (for old age income) and Medicare (for old age health care) are the largest social insurance programs in the United States. They are also our largest budget expenditures. Since these programs are not fully funded, reforms are needed to ensure their long-term sustainability. Think about how you would like to see these programs reformed—and tell your government representatives!
List of terms
- Social safety net
- Medicare
- Medicaid
- Private insurance
- Premium
- Social insurance
- Social Security
- Stocks
- Dividends
- Bonds
- Interest
- Annuities
- 401(k)s
- Behavioral economics
- Tax incidence
- Unemployment insurance
- Budget surplus
- Budget deficit
- Debt
- Entitlements
- Pay-as-you-go
- Fully funded
References
Bertrand, Marianne, Sendhil Mullainathan, and Eldar Shafir. “A Behavioral-Economics View of Poverty.” American Economic Review 94, no. 2 (2004): 4.
Board of Governors of the Federal Reserve. “Report on the Economic Well-Being of U.S. Households in 2014,” 2016. http://www.federalreserve.gov/econresdata/2014-report-economic-well-being-us-households-201505.pdf.
Boone, Christopher, Arindrajit Dube, Lucas Goodman, and Ethan Kaplan. “Unemployment Insurance Generosity and Aggregate Employment.” American Economic Journal: Economic Policy 13, no. 2 (2021): 58–99. doi:10.1257/pol.20160613.
Congressional Budget Office. “The Budget and Economic Outlook: 2024 to 2034,” 2024.
———. “The Long-Term Budget Outlook: 2024 to 2054.” Congressional Budget Office, 2024.
Goda, Gopi Shah, Matthew R. Levy, Colleen Flaherty Manchester, Aaron Sojourner, and Joshua Tasoff. “Who Is a Passive Saver under Opt-In.” IZA Discussion Paper Series. Bonn, Germany, 2019.
Kekre, Rohan. “Unemployment Insurance in Macroeconomic Stabilization.” Review of Economic Studies 90, no. 5 (2023): 2439–80. doi:10.1093/restud/rdac080.
Knoll, Melissa A. Z. “The Role of Behavioral Economics and Behavioral Decision Making in Americans’ Retirement Savings Decisions.” Social Security Bulletin 70, no. 4 (2010): 1–23. doi:10.1007/s11149-011-9180-1.
Kovalski, Manuel Alcalá, and Louise Sheiner. “How Does Unemployment Insurance Work? And How Is It Changing during the Coronavirus Pandemic?” Brookings, 2020. https://www.brookings.edu/articles/how-does-unemployment-insurance-work-and-how-is-it-changing-during-the-coronavirus-pandemic/.
Krueger, Alan B., and Jörn-Steffen Pischke. “The Effect of Social Security on Labor Supply: A Cohort Analysis of the Notch Generation.” Journal of Labor Economics 10, no. 4 (1992): 412–37.
Kuka, Elira. “Quantifying the Benefits of Social Insurance: Unemployment Insurance and Health.” Review of Economics and Statistics 102, no. 3 (2020): 490–505. doi:10.1162/rest_a_00865.
Landais, Camille, and Johannes Spinnewijn. “The Value of Unemployment Insurance.” Review of Economic Studies 88, no. 6 (2021): 3041–85. doi:10.1093/restud/rdaa086.
Madrian, Brigitte C., and Dennis F. Shea. “The Power of Suggestion: Inertia in 401(k) Participation and Savings Behavior.” Quarterly Journal of Economics 106, no. 4 (2004): 1149–87.
Marinescu, Ioana, and Daphné Skandalis. “Unemployment Insurance and Job Search Behavior.” Quarterly Journal of Economics 136, no. 2 (2021): 887–931. doi:10.1093/qje/qjaa037.
Martin, Patricia P, and David A Weaver. “Social Security: A Program and Policy History.” Social Security Bulletin 66, no. 1 (2005): 1–15.
Mastrobuoni, Giovanni. “Labor Supply Effects of the Recent Social Security Benefit Cuts: Empirical Estimates Using Cohort Discontinuities.” Journal of Public Economics 93, no. 11–12 (2009): 1224–33. doi:10.1016/j.jpubeco.2009.07.009.
OECD. “OECD | Social Spending,” 2024. https://www.oecd.org/en/topics/sub-issues/social-spending.html.
Pepin, Gabrielle, Christopher J. O’Leary, Kenneth J. Kline, and Ting Zhang. “Reemployment Services and Eligibility Assessments (RESEA) in Maryland — Program Year 2020 Evaluation.” Upjohn Institute Technical Reports, 2023.
Picchi, Aimee. “One Way to Fix Social Security? ‘Smash the Cap.’” CBS Money Watch, 2023. https://www.cbsnews.com/news/social-security-benefits-tax-cap-2023/.
Platt, Eric. “Amazon Seals $16bn Corporate Bond Sale.” Financial Times, August 15, 2017.
Ready, Dan, Jorge Salazar, and Caitlin Verboon. “The Federal Fiscal Budget in 2023: A Closer Look at Discretionary Spending.” Congressional Budget Office, 2024.
Roushdy, Rania, and Irene Selwaness. “Duration to Coverage: Dynamics of Access to Social Security in the Egyptian Labor Market in the 1998-2012 Period.” In The Egyptian Labor Market in an Era of Revolution, edited by Ragui Assaad and Caroline Krafft, 241–58. Oxford, UK: Oxford University Press, 2015.
Social Security. “Contribution and Benefit Base,” 2024. https://www.ssa.gov/oact/cola/cbb.html.
The Board of Trustees of the Federal Old-Age and Survivors Insurance and Federal Disability Insurance Trust Funds. “The 2024 Annual Report of the Board of Trustees of the Federal Old-Age and Survivors Insurance and Federal Disability Insurance Trust Funds,” 2024.
- Social Security, 2024. ↵
- Roushdy and Selwaness, 2015. ↵
- OECD, 2024. ↵
- Including for old age, disability, health, family, active labor market policies, unemployment, housing, and other social spending (e.g. SNAP in the U.S.). ↵
- Platt, August 15, 2017. ↵
- Board of Governors of the Federal Reserve, 2016. ↵
- Knoll, 2010. ↵
- Bertrand, Mullainathan, and Shafir, 2004; Knoll, 2010; Madrian and Shea, 2004; Goda et al., 2019. ↵
- Martin and Weaver, 2005. ↵
- Ibid. ↵
- Ibid. ↵
- Ibid. ↵
- Social Security, 2024. ↵
- Mastrobuoni, 2009; Krueger and Pischke, 1992. ↵
- Kovalski and Sheiner, 2020. ↵
- Ibid. ↵
- Pepin et al., 2023. ↵
- Kovalski and Sheiner, 2020. ↵
- Landais and Spinnewijn, 2021. ↵
- Kekre, 2023. ↵
- Kuka, 2020. ↵
- Marinescu and Skandalis, 2021. ↵
- Boone et al., 2021. ↵
- Congressional Budget Office, 2024. ↵
- Ready, Salazar, and Verboon, 2024. ↵
- Congressional Budget Office, 2024. ↵
- We also have debt held by government trust funds rather than the public, essentially different parts of the government owing each other money. ↵
- Congressional Budget Office, 2024. ↵
- The Board of Trustees of the Federal Old-Age and Survivors Insurance and Federal Disability Insurance Trust Funds, 2024. ↵
- Ibid. ↵
- Picchi, 2023. ↵
- Ibid. ↵
