
4 Results
The content seemed mostly appropriate to the skill levels and interests of the participants. Most people really liked the book Effective Data Storytelling: How to Drive Change with Data, Narrative and Visuals. Some people felt overwhelmed reading a whole book, even though that was the plan when they applied.
The format worked for the most part. People were engaged during our live sessions on Zoom and especially appreciated getting feedback on their projects. Overall, using D2L Brightspace to house the course worked, though it was awkward for our participants who had not already used it.
The big theme that emerged was that it was difficult for participants to keep things small and doable, especially for their projects, but even when it came to reading the book. (Yes, it is OK to skim the text if needed!)
The group was active and interested in each other’s perspectives and participants brought varied experience and knowledge. Two instructors and 7 participants was a nice size for the group.
Participants and their Final Projects
- Anoka Technical College (Deanna Munson) – https://mediaspace.minnstate.edu/media/Deanna/1_5n4atf5l
- Bethany Lutheran College (Alyssa Inniger) – https://www.youtube.com/watch?v=ahOnN9M9zUk
- Century College (Shana Crandall) – https://mediaspace.minnstate.edu/media/2023%20Library%20Instruction%3A%20Closing%20the%20Gaps%20in%20Student%20Success%20-%20Shana%20Crandall%20/1_ukg8k9i1
- Hennepin Technical College (Adam Bezdicek) – https://mediaspace.minnstate.edu/media/t/1_erbtcrhj
- Minnesota Department of Transportation (Karen Neinstadt) – https://mnscu.sharepoint.com/:p:/s/MNSU-PALS-Dev/EZZUidzdCdtKq3Je7NOVlzIBTcqHCvs5xvVsSJnX_IpL_Q?e=FfC8WA
- Southwest Minnesota State University (Maria Kingsbury) – https://mediaspace.minnstate.edu/media/Data+Storytelling+Final/1_juwectzn
Final Survey Results
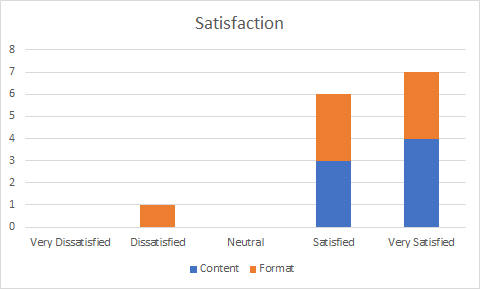
Satisfaction with Effective Data Storytelling was high:
- 57% were very satisfied with the content
- 43% were very satisfied with the format
Most importantly, they all agreed that they felt better equipped to act and move forward with their data storytelling.
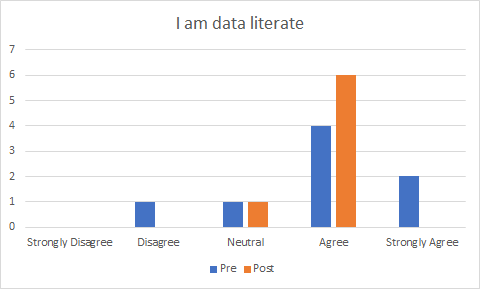
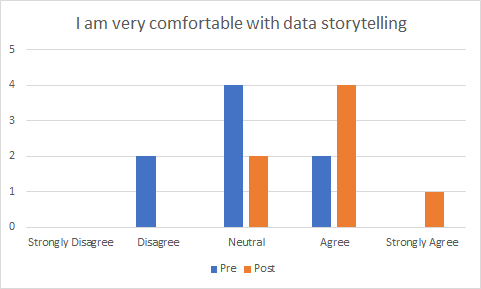
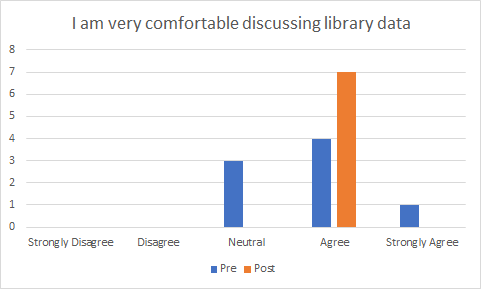
We asked the same five data questions before and after the short course and we did see improvement. Here are charts with the details:


Some of the responses to the final question: Anything else you want your facilitators to know?
- I had a wonderful experience in the class!
- Thank you so much for creating and teaching it. I learned so much!
- THANK YOU! I loved the class, just as I did last year, and I learned a TON. You two are a rock-star duo, and the group of folks you assembled was pretty amazing. I’ll go to anything you put on.
- Thank you for all your work on this! It was no small thing to put together, and I learned many new things that I want to put into practice. I hope this happens again next summer. June might be easier for me, but July worked fine. Thanks again!
- I had fun doing this and learned a huge amount from the other librarians. Thanks for designing it.
A few more final thoughts, which are nearly the same as last year:
- Creating a visual aid (slides for most people) and video did seem to cause anxiety for some participants. These are great skills to have for outreach and teaching. In most cases, that anxiety can be overcome with continued practice.
- We all need practice talking about our data and we need to take those opportunities when they arise.
- Revision really helps, as does feedback from others.
