
17 Strategy: Reading Charts and Graphs
Visual data is meant to be “read,” just like text on a page. Images with data often contain crucial information that isn’t available elsewhere in a text.
Ask these questions when you encounter visual data in your reading:
What is the topic?
look for the title and reword it in your own words
What is being measured?
look for labels to get an idea of what the graph is saying
How is it being measured?
look for units
ask yourself if the units make sense with what you know about the graph so far
Is color-coding use and if so, how?
color-coding is often used to add additional information to a graph without taking up extra space
check for a key that explains the color coding
Can I summarize this information in my own words?
look for a trend or a piece of information that you find interesting and mentally form a sentence about it
if you are struggling with this step, don’t get frustrated or give up–start over from Step 1. Each time you investigate the graph you are building up your knowledge and understanding of the information.
CC LICENSED CONTENT, ORIGINAL Revision and Adaptation. Provided by: Lumen Learning. License: CC BY: Attribution
CC LICENSED CONTENT, SHARED PREVIOUSLY 5 Step Approach for Reading Charts and Graphs. Located at: https://unh-rwt.wikispaces.com/5+Step+Approach+for+Reading+Charts+and+Graphs. Project: Reading, Writing, and Technology.
Built-In Practice: Reading Charts and Graphs
Answer questions about the following graphs.
Basketball Scores
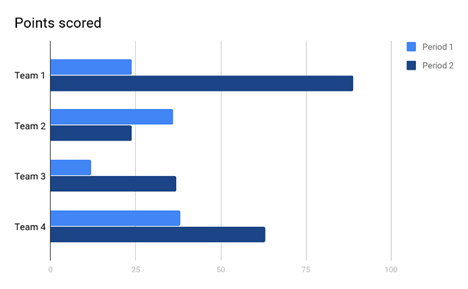
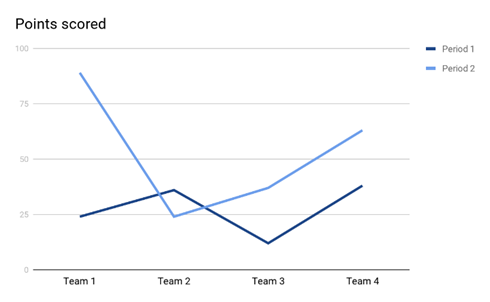
- What is the topic?
- What is being measured?
- How is it being measured?
- Is color-coding used and if so, how?
- Can I summarize this information in my own words?
CC LICENSED CONTENT, ORIGINAL Revision and Adaptation. Provided by: Lumen Learning. License: CC BY: Attribution
CC LICENSED CONTENT, SHARED PREVIOUSLY 5 Step Approach for Reading Charts and Graphs. Located at: https://unh-rwt.wikispaces.com/5+Step+Approach+for+Reading+Charts+and+Graphs. Project: Reading, Writing, and Technology.
