
12 Linear Best Fit
When adding a linear trendline in Excel or other computer program, the computer performs a least squares regression calculation on the data to create the best line that fits the data. The result is the equation of the line in the form
y = mx + b
where m is the slope and b is the y-intercept (the point where the line crosses the y-axis). The slope is defined as the change in the y-axis over the change in the x-axis
[latex]slope=\frac{\Delta y}{\Delta x}=\frac{y_2-y_1}{x_2-x_1}=\frac{rise}{run}[/latex]
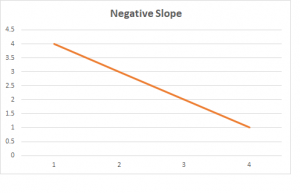
where the two x and y points are taken from the line, not the data. A positive slope is when the line angles upwards (from left to right) and occurs when the dependent variable increases as the independent variable is increased. A negative slope is when the line angles downwards (from left to right) and occurs when the dependent variable decreases as the independent variable increases.

Chemists often use the equation of a line generated from their data to calculate the y-value for a value of x they didn’t measure. Or, they can measure the y value for a sample with an unknown x to determine the value of x. Each of these methods is illustrated in the following examples.
Example 12.1
Suppose you measured the pressure of a sample of gas at various temperatures, graphed Pressure vs Temperature, and obtained the following equation of a line: y = 0.2078 kPa·K-1 x + 0.0171 kPa (where kPa and K are units). What would be the pressure of this gas at 425 K?
Answer: Since you controlled temperature and measured pressured, temperature is on the x-axis and absorbance is on the y-axis. You want to know the y value that corresponds to an x value of 400 K, so plug that value of x into the equation.
y = (0.2078 kPa·K-1)(425 K) + 0.0171 kPa = 88.3 kPa
Example 12.2
Suppose you measured the absorbance of eight solutions as a function of concentration, graphed Absorbance vs Concentration, and obtained the following equation of a line: y = 0.440 M-1 x + 0.080 (where M-1 are the units on the slope). If you had a sample with unknown concentration that had an absorbance of 0.232, what is the concentration of the sample?
Answer: Since you controlled concentration and measured absorbance, concentration is on the x-axis and absorbance is on the y-axis. You measured a y value and want to calculate an x value. Therefore, rearrange the equation of the line to solve for x
x = (y – 0.080)/0.440 M-1
Now plug in the measured value of y for your unknown and solve
x = (0.232 – 0.080)/0.440 M-1 = 0.345 M
Excel and other programs also calculate R-squared, which is a statistical measure of how close the data are to the fitted regression line. The value of the R-squared ranges from 0 to 1, with 1 being a perfect fit. Most data collected in chemistry labs should have an R-squared greater than 0.9.
