
2 Results & Discussion
Content
The content seemed appropriate to the skill levels and interests of the participants. There were many optional resources in addition to the requirements, so participants could choose their own adventure. People were engaged during the meetings and we had detailed discussions.
An important theme emerged through the content and discussions. Context is key. We can explain our numbers better. We can describe our charts better. We can tell more of the story surrounding our data. Giving context really helps people connect and understand.
Topics where participants indicated they wanted more resources:
- Statistical significance
- Visualization
- Privacy/ethics
Format
Overall, using D2L Brightspace to house the course and Zoom for four live sessions worked well. Everyone used their web cams and that contributed to a more robust experience.
We received some suggestions to tweak the timing a bit, for example to introduce the project at the beginning so that participants could begin to work on it earlier.
Another theme that emerged with the project was that it was difficult for participants to keep the scope small and focused. They all had the tendency to want to solve big, systemic problems, which was unrealistic for the time we had allotted.
The Participants and their Projects
The group was active and interested in each other’s perspectives and participants brought varied experience and knowledge. Two instructors and 9 participants was a nice size for the group. Participants were:
- Lisa Abrazo – North Hennepin Community College
- Adam Bezdicek – Hennepin Technical College
- John Daniels – Minneapolis Community and Technical College
- Maria Kingsbury – Southwest Minnesota State University
- Patrick Leeport – Bemidji State University
- Deanna Munson – Anoka Technical College
- Katharyn Rolfe – Lake Superior College
- Jennifer Sippel – Minneapolis Community and Technical College
- Monica Wigdahl – Hennepin Technical College
An interesting theme emerged here: pairs working together. We had two sets of pairs in our participants where one leaned more towards data and the other leaned more towards story-telling. Similarly, having two instructors with complementary skills made this course better than it would have been with just one of us. The participant pairs really did nice work and seemed less stressed about the project than the others. Here are their projects:
- Anoka Technical College – https://drive.google.com/file/d/1eJiJkK0xZb9c6Mwk5Zuq-I_ltlmeJVla/view?usp=sharing
- Bemidji State University – https://mediaspace.minnstate.edu/media/A.C.+Clark+Library+Data/1_jbfltpu1
- Hennepin Technical College – https://mediaspace.minnstate.edu/media/HTC+Library+Laptop+ProgramA+Impact+on+Equity+%26+Student+Success+-+FY22/1_5cnldyrn
- Lake Superior College – https://mediaspace.minnstate.edu/media/LSC-Big+Project/1_i5srau17
- Minneapolis Community and Technical College – https://mediaspace.minnstate.edu/media/MCT-Big+Project/1_3aggdqkb
- North Hennepin Community College – https://mediaspace.minnstate.edu/media/NHCC+Annual+Report+Lisa/1_7zciay3l
- Southwest Minnesota State University – https://mediaspace.minnstate.edu/media/Data+Literacy+Presentation/1_n5ccji9t
Final Survey Results
All participants were satisfied with the data intensive and:
- 67% were very satisfied with the content
- 56% were very satisfied with the format
In addition, they all agreed that they felt better equipped to act and move forward with their library data.
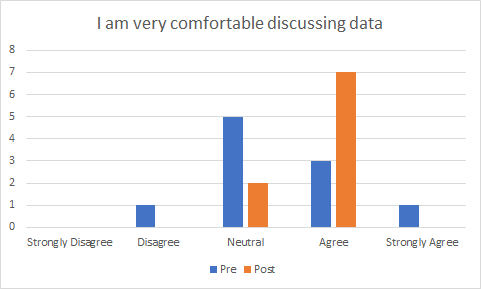
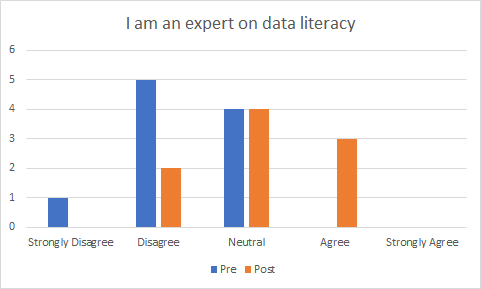
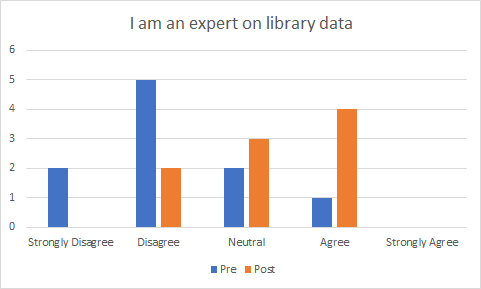
We asked the same three data questions before and after the short course and we did see improvement. Here are charts with the details:
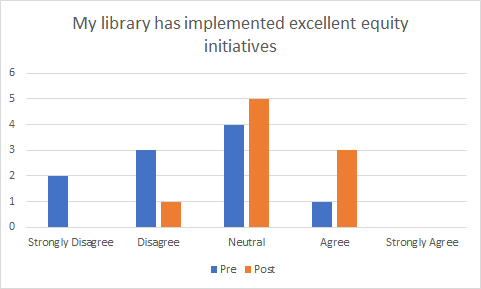
We also asked two equity questions before and after the short course and we did see improvement. Here are charts with the details:

A few more final thoughts:
- One thing to note that was interesting: creating a visual aid and video did seem to cause anxiety for some participants. These are great skills to have for outreach and teaching. In most cases, that anxiety can be overcome with continued practice.
- We all need practice talking about our data, and we need to take those opportunities when they arise.
- Revision really helps, as does feedback from others.
- We have nine library data ambassadors now!
