
Lab #5 Preview
One Sample t Test
Purpose
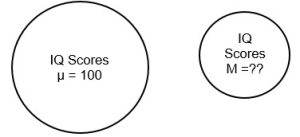
Compare a sample mean to a known population mean. Is the sample mean significantly different from the population mean?
Examples of one sample t-tests might be to see if the sample of college students in your study is the same average age as the entire university, or if the sample of male basketball players you have is the same average height as the general population. For our lab, the question is about a sample of 3rd graders at a private school and their intelligence test scores. IQ scores are normed such that the average IQ in a population is always 100, so we can compare our sample to that known population average.
Population: all 3rd graders Sample: 3rd graders at a private school
Measures (DVs):
- iqbef = IQ before 3rd grade
- iqaft = IQ after 3rd grade
Null Hypothesis: Mean IQ for private school = 100 (no difference in IQ scores at private school)
Alternative Hypothesis: Mean IQ for private school ≠ 100 (IQ scores at private school are different)
One sample t-test is a test of the null hypothesis. Based on test results and the p-value, we either:
- Reject the null hypothesis (and conclude that the means likely differ), or
- Fail to reject the null hypothesis (and conclude the means do not differ significantly)
APA Style
APA style has a standard way to report hypothesis testing results. The data you would want to report for a one sample t-test would be the mean of the sample, the standard deviation of the sample, and the mean of the population. You’ll also need to say whether the results were “significant” (when you reject the null) or “not significant” (when you fail to reject the null) in your wording and make conclusions about the mean being smaller, bigger, not different, or whatever makes sense and is supported by your analysis! You would then also, at the end of your sentence(s), add what I call “the t statement”, which notes the calculated t-value, the degrees of freedom (always in parentheses after the t symbol), the p-value, and the effect size (using Cohen’s d) as is shown in the examples below. For the p-value, you can report either the exact value as given in SPSS or that the p is < or > .05, assuming that .05 is our chosen alpha value. For example (with made up numbers), you might see something like either of the following to report a one sample t-test in APA Style:
- The average age of the sample of students was 20.1 years (SD = 1.4) which was not different from the average age at the school of 19.8 years, t(54) = 1.24, p > .05, d = .21.
- The basketball players were significantly taller (M = 74.2 inches, SD = 3.6) than the general population of males (µ = 69.5 inches), t(28) = 3.29, p = .004, d = 1.30.
Remember, we write out statistical terms in the sentence (the first example, with “the average age was”) but use symbols when we refer to the statistics in parentheses (the second example, with “M =” and “µ =”; remember that µ is the symbol for population mean).