
Lab #1 Introduction to SPSS
Watch this video from the RStats Institute at Missouri State University for a good introduction to SPSS. The video focuses on how to define variables and enter data into SPSS – these are some things that you will be doing in the first lab assignment. Note: if the video doesn’t play here, click the link to Watch on YouTube. This is just an introductory video and not part of the actual lab assignment.
In this laboratory you will learn how to:
- Start SPSS
- Define and enter data
- Execute SPSS commands
- View statistical outputs and insert text annotations
- Save SPSS files
- Exit SPSS
Learning Objectives
This laboratory addresses the following course objectives:
- Perform basic file operations in SPSS.
- Enter data into SPSS.
- Execute SPSS commands using Syntax Editor.
- Interpret SPSS outputs.
Introduction
IBM SPSS is a statistical analysis package that you can use to analyze research data. It allows data to be entered in a simple spreadsheet format or to be read in from a data file produced by another program. You can enter statistical analysis commands either through menu and dialog box choices (point-and-click method) or by typing them directly in a command window like computer code (syntax method). Statistical output is presented in a viewer window that can display both tables and charts. Data in the spreadsheet format, commands in the syntax window, and output of statistical analyses can all be viewed within SPSS, printed, or saved to a file.
Basic Guidelines
During this lab you will be asked to run specific SPSS commands. To demonstrate that you have accomplished this you will be producing an “annotated” output file. This file will contain your data, your statistical outputs, and some comments (annotations) interpreting your tables and charts. After running the statistical functions and adding the annotations, you will be saving your output file and then submitting it to your instructor for grading in D2L Brightspace.
Start SPSS
Once SPSS has been installed on your computer, it should be easy to locate and start SPSS from your application menu or through your program search tool. Ask your instructor or lab assistant if you need assistance with this. Note that the screen images shown in these laboratory tutorials were captured while using the SPSS version 28 for Windows. If you are running SPSS on a Mac or running a newer version of SPSS, your screens may look a bit different.
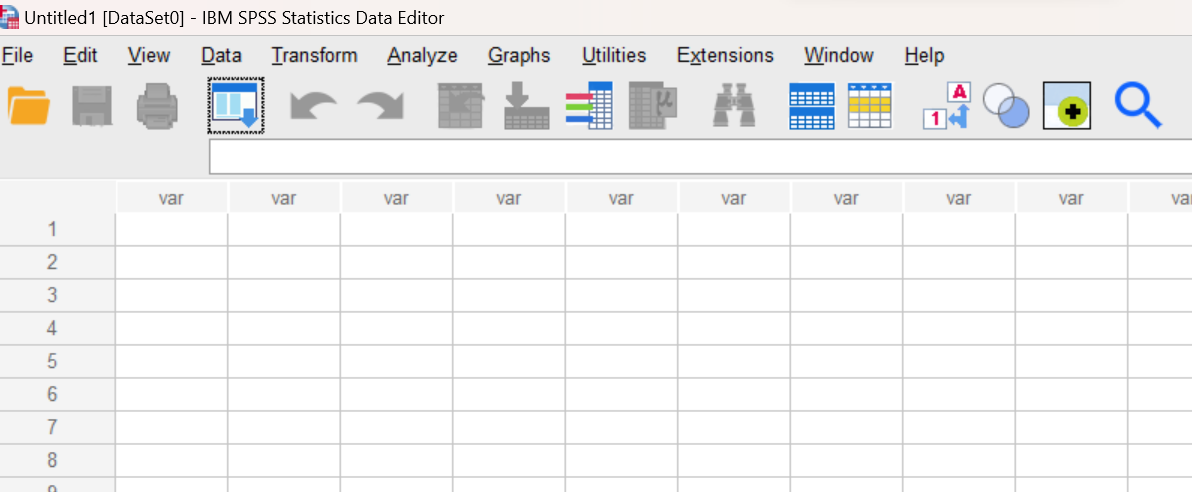
As SPSS starts, you may see a Welcome screen that gives options for opening files or viewing tutorials. Just press the close button to close that window and then you should see a spreadsheet-type window called the Data Editor, which should look something like the following:
In addition to the Data Editor, there will be two additional types of windows you will be using later – the Syntax Editor and the Statistics Viewer. It’s important to keep track of the differences between these three windows:
The DATA EDITOR window is where you will input data, either by hand or by importing a data file.
The SYNTAX EDITOR window is where you will type in commands that tell SPSS what you want it to do with the data.
The STATISTICS VIEWER (or “output”) window displays the results of the commands you typed into SPSS or that you ran through the dropdown menu options.
Entering Data and Naming Variables
Let’s enter a bit of data at this point so you can see how the Data Editor works. Suppose we want to analyze the following set of data consisting of 10 exam scores from the students in a psychology class:
|
Score |
|
75 |
|
68 |
|
63 |
|
58 |
|
95 |
|
87 |
|
75 |
|
66 |
|
92 |
|
71 |
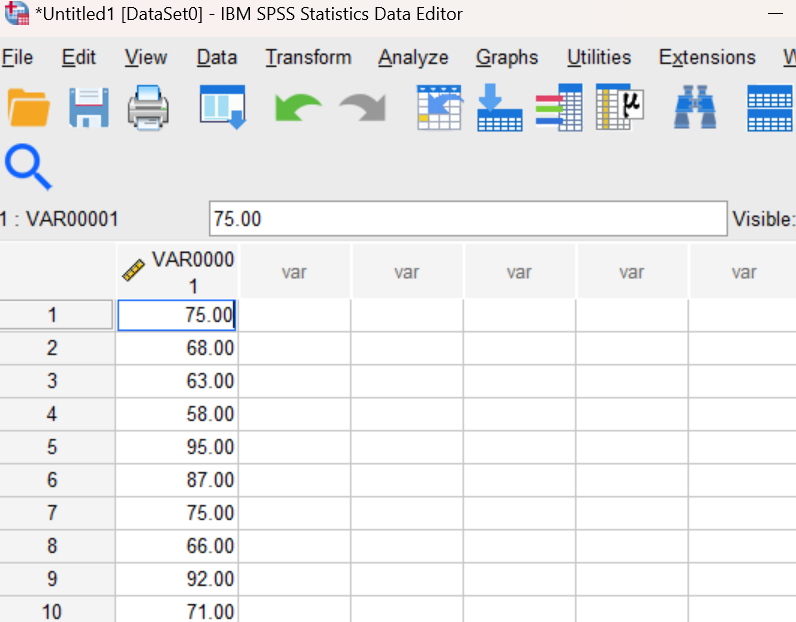
Click on the upper-left cell in the Data Editor (row 1, column 1 of the spreadsheet) and then type the first exam score (75). Use the down-arrow key to move to the second row (row 2, column 1 of the spreadsheet) and enter the second score (68) right under the first.
Repeat this process to enter the data for the rest of the scores so that they are all arranged in the first column. You will notice that SPSS automatically adds two decimal places for each score. Don’t worry about that for now, we will fix it later. When you are finished, your Data Editor window should look as shown here:
Notice that as you enter data into the Data Editor, SPSS assigns a default name (in this case “VAR00001”) for each variable. Let’s change this default to a more meaningful name. If you look at the bottom of your Data Editor window you will see that there are two tabs:
![]()
To name and define variables, you will need to click on the “Variable View” tab. This will take you to a new spreadsheet view where each row represents one of your variables. In this case, we only have one variable (“VAR00001”). Use your mouse to place your cursor in that first cell of the spreadsheet and replace the “VAR00001” name with “Score” as shown here:
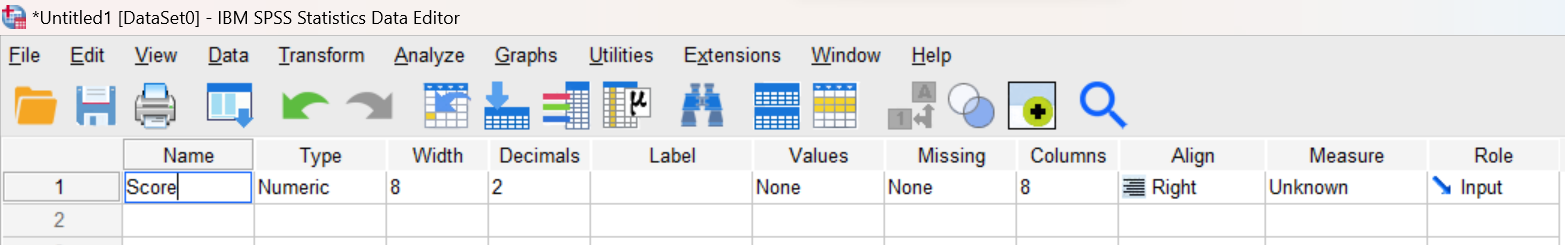
While you are here, also go ahead and change the number in the Decimals column from 2 to 0. This will get rid of those extra decimal places that are being displayed for each of your scores. The variable – exam scores – is a ‘scale” variable, so change the measure type to say ‘Scale’ as well. When you’re done defining your variable, click on the “Data View” tab at the bottom of your Data Editor window to go back to the original spreadsheet view showing your data. Notice that your new variable name now appears as a header in that first column.
Running SPSS Commands Using the Syntax Method
One way to run SPSS commands is to type them into a window called the Syntax Editor, which runs commands for analyses using computer code. Use the File menu at top of your current window to open a Syntax Editor window (File→New→Syntax). Note that you can resize this window to any convenient size.
A third window, the Statistics Viewer, will appear when you actually run the commands. To see this window, type the following command in the Syntax Editor window:
SHOW VERSION.
Be sure to include the period at the end of the command. With your cursor somewhere on the command line, press the right pointing green triangle icon at the top of the Syntax Editor window to run this command.

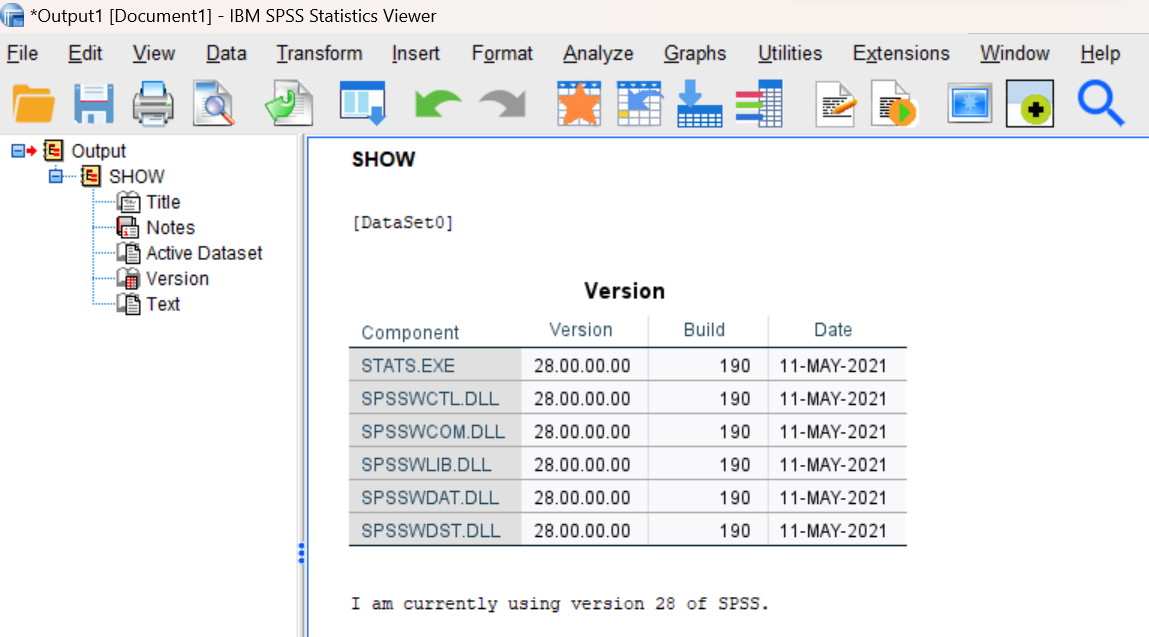
At this point you should notice that the Statistics Viewer (output) window has opened, and it contains a table with the “Version” number of the SPSS software you are using.
Note on typing of commands: SPSS is VERY picky about typing in the commands EXACTLY as indicated. You must spell the words correctly, put a period at the end of each command, etc. If you make mistakes, you will get error messages or incorrect outputs. In some rare cases, SPSS may not be able to recover, and you will have to close EVERYTHING DOWN and START OVER. So, please be EXTREMELY MINDFUL of what you are typing in. SPSS doesn’t care about upper vs. lower case, but spelling and punctuation MUST BE EXACT!
Annotating Your SPSS Output
Let’s add a simple annotation to your output at this point, just for practice. Follow these instructions to insert a text box:
Step 1. Be sure nothing is currently highlighted in the Statistics Viewer window before proceeding or your text will not be inserted properly.
Step 2. Click on the last (bottom) icon in the left-hand pane of the Statistics Viewer window to move your current position to the bottom of the file. You will see a small red arrow indicating your current position, as shown below:
Step 3. Now select “New Text” from the Insert menu (Insert→New Text). This should open a new text box in your output file. Type a sentence in this box stating the version number of your SPSS software as given in your Show Version command output.
Step 4: When you are finished typing in the new text, click somewhere outside of the text box to make sure that the text box is de-selected and your text is saved. The resulting annotation should appear in your output window as shown here:
At this point, you should have three different SPSS windows open: Data Editor, Syntax Editor, and Statistics Viewer. Practice switching between them, minimizing and restoring them, moving them around, etc. Again, it is important that you understand the differences between these three windows and it will be important that you are comfortable navigating between them on your computer screen.
Listing Your Data
Next, let’s see if we can get a copy of your data into the output file. The LIST command provides a way to view the data that has been entered into SPSS. (This command is useful for our lab assignments where you turn in your output and this allows your instructor to see that you have entered the data. It’s not a particularly useful command in research projects, but we are using it here to help you learn how to add commands and use syntax.) Navigate back to your Syntax Editor window (the one containing the Show Version command). Use your mouse to position your cursor at the end of the current line (after the period) and press the Enter key to start a new line. Then type the following command to view the exam score data you entered earlier:
LIST /VARIABLES = ALL.
Remember to include the period at the end of the command. Press the right-pointing green triangle icon at the top of the window to run this command. SPSS will display the results of this command in the Statistics Viewer window. View the output and compare against the original data table to verify that your data has been entered correctly. If you discover any mistakes, go back to the Data Editor to make the appropriate changes, and then run the List command again from the Syntax Editor.
Note on deleting unwanted outputs: If you have any warning messages, error messages, duplicated tables, or other unwanted items in your output file, you should delete them before submitting your file for grading. To delete an item, simply select the item by clicking on it with your mouse, and then press the Delete key on your keyboard.
At this point, your Statistics Viewer window should contain the outputs from the Show Version and List commands as well as your annotation for the Show Version command as shown below:
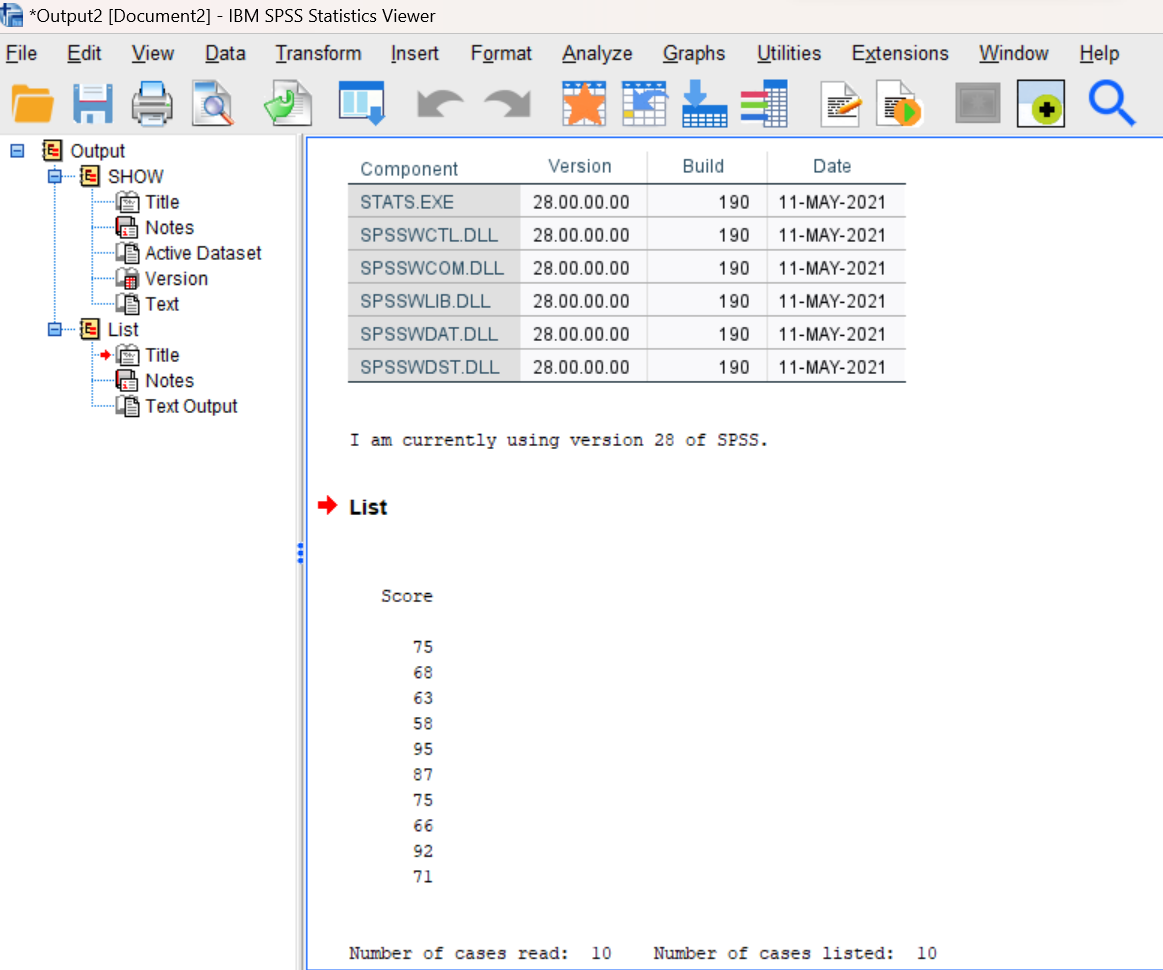
Notice that there are two panes in the Statistics Viewer window. The left-hand pane provides an outline showing the structure of the statistical output that has been produced. The right-hand pane displays the actual outputs for the commands that you have run.
Click on the various parts of the outline in the left-hand pane and notice how the related outputs in the right-hand pane are then selected. Note that you can copy and paste the various items in this window to other programs such as Microsoft Word or Excel. You will need to do this for some of our other course assignments.
Inserting Your Name
We are just about done! But before submitting your work for grading, you will need to add one more text annotation with your name at the top of your SPSS output file. The procedure will be the same as inserting text at other points in the file, but this time, we want the text inserted at the very top of the file. Follow these instructions:
Step 1. Be sure nothing is currently highlighted in the Statistics Viewer window before proceeding or your text will not be inserted properly. (Just click your mouse on a white area of the screen to remove any current selections.)
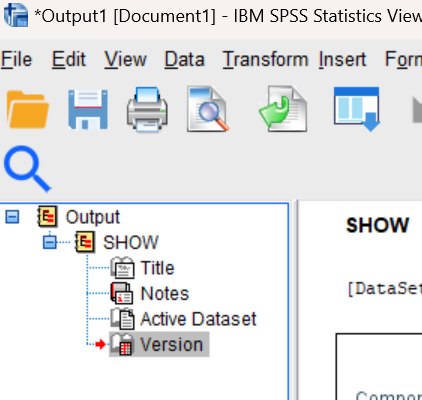
Step 2. Click on the top (yellow) icon in the left-hand pane of the Statistics Viewer window to move your current position to the top of the file as shown in the figure below. You will see a small red arrow indicating your current position.
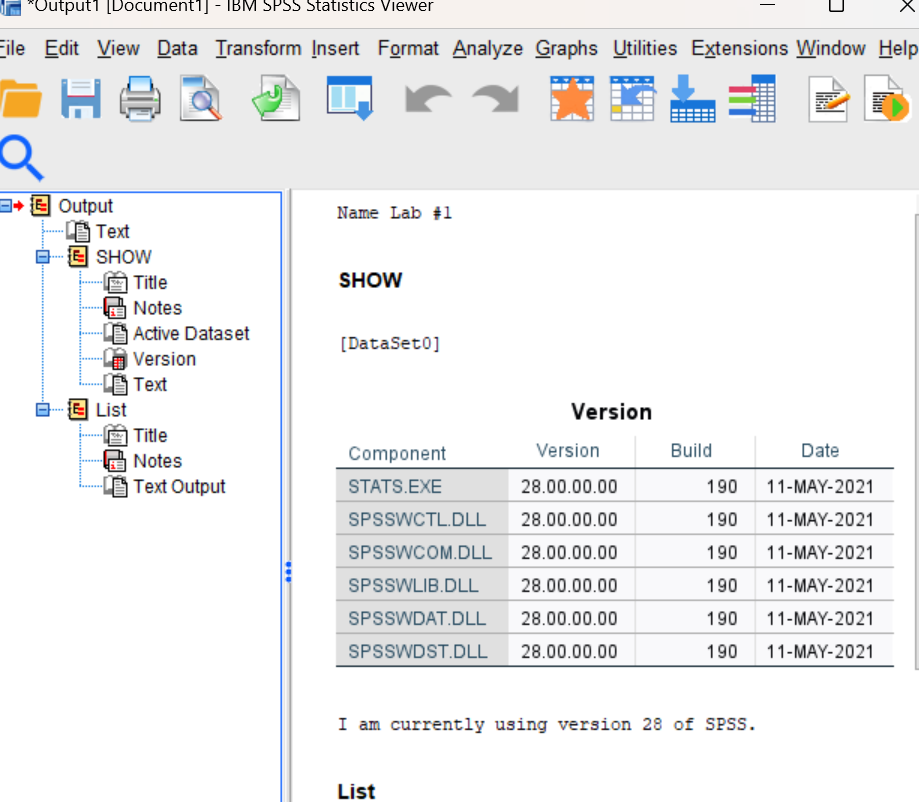
Step 3. Select “New Text” from the Insert menu (Insert→New Text). This should open a new text box at the top of your output file. Type your name and lab number (Lab #1) in the resulting box.
Step 4: When you have completed typing in the new text, click somewhere outside of the text box to make sure that the text box is de-selected, and your text is saved. The contents of your Statistics Viewer window should now be similar to what is shown here:
Save Your Work and Exit SPSS
Before exiting SPSS, you will need to save your work. This is done through the “Save” or “Save as” command available in the File menu in each window (File→Save as). It is highly recommended that you use the “Save as” option and specify a location on your computer, personal USB drive, or network workspace (if using a campus computer) where you can find the file once you have exited SPSS. Note that each window must be saved separately, so you will need to do three Saves to save everything. Also, for longer labs, it is recommended that you save your windows at various times while completing the assignment so that you don’t lose any progress you made if something happens (loss of power, for example) while you are working!
- Let’s start by saving the contents of your Data Editor window. Give your data file a meaningful name (e.g., Lab 1 Exam Scores), so you can find it easily in the future.
- Now do the same for your Syntax Editor window. Give the file a meaningful name (e.g., Lab 1) so that it can be identified with this lab assignment.
- Finally, let’s do the same for your Statistics Viewer window. Again, give your file a meaningful name (e.g., Lab 1) so that it can be identified with this lab assignment.
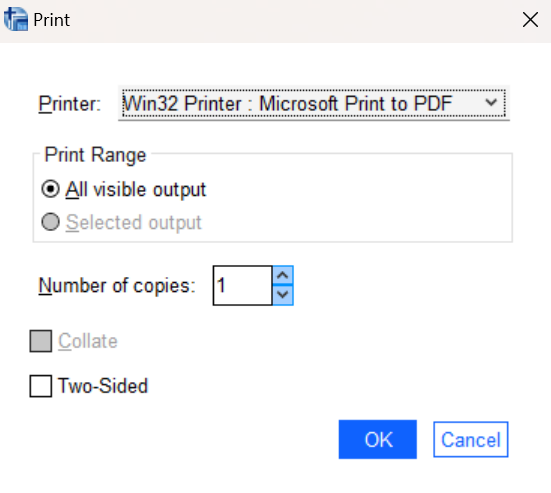
- After you save the Output file (Statistics Viewer window), you will need to save a PDF version of it as well. This is a very important step, because this is the file you will need to submit to your instructor for grading. Begin as if you are going to print the document (File→Print), and then in the drop-down menu, choose Print to PDF from the list of Printer options. See the example below. Be sure to select the ‘All visible output’ option. Press the OK button and then specify the location where you’d like the file to be saved.
Note on SPSS file names: It’s okay to use the same file name for your data, syntax, and viewer files, because SPSS will automatically give them different file extensions. The Data Editor file will be saved with a .sav extension; the Syntax Editor file will be saved with a .sps extension; and the Statistics Viewer file will be saved with a. spv extension (as well as the .pdf extension file you create).
Now that your work has been saved, let’s go ahead and exit SPSS. To exit SPSS, select the Exit option from the File menu in the active SPSS window (File→Exit). If you have not saved the contents of your SPSS windows as instructed above, you may be prompted to do so at this time. If you have already saved your work as instructed, then just answer “no” to the prompts, otherwise answer “yes” and do so now. After SPSS has been closed, you will return to the Desktop.
Submit Your Lab
Remember to submit the PDF version of your completely annotated SPSS output file when you are done. It should be uploaded to the folder for this assignment in the D2L Brightspace Assignments area. Make sure your name is included at the top of the file. Once you have uploaded your file to D2L Brightspace, open the file from that location in D2L and double check to make sure you have submitted the correct file.
Tip for next week
REVIEW THE BASICS – you will need to know them for the next lab… After completing this first lab, you should know the purposes of the three SPSS windows, the functions of the various commands that you ran in SPSS, how to insert text into your SPSS output file, and how to save your work. Make sure that you understand what you are doing in each lab – not just blindly following the steps in the tutorial… If something doesn’t make sense, or you aren’t able to get something to work correctly, this is the time to ask questions…