
Lab #3 Descriptive Statistics
Watch this video from the RStats Institute for a good introduction to generating descriptive statistics in SPSS. There is a section at the end about having SPSS compute z-scores. We will not be using this feature in this course, but definitely useful to know about! Note: if the video doesn’t play here, click the link to Watch on YouTube.
In this laboratory you will learn how to:
- Load an SPSS system data file
- Compute descriptive statistics for continuous variables
- Display descriptive statistics broken down by a categorical factor
Learning Objectives
This laboratory addresses the following course objectives:
- Perform basic file operations in SPSS.
- Execute SPSS commands using syntax editor and menu system.
- Interpret SPSS outputs.
Introduction
Before performing statistical analyses, researchers generally take some time to explore their data. The main goal of this exploration is to understand how the data are distributed. As we saw in the previous lab, SPSS provides commands to display frequency distributions in several different formats such as tables, charts, and graphs.
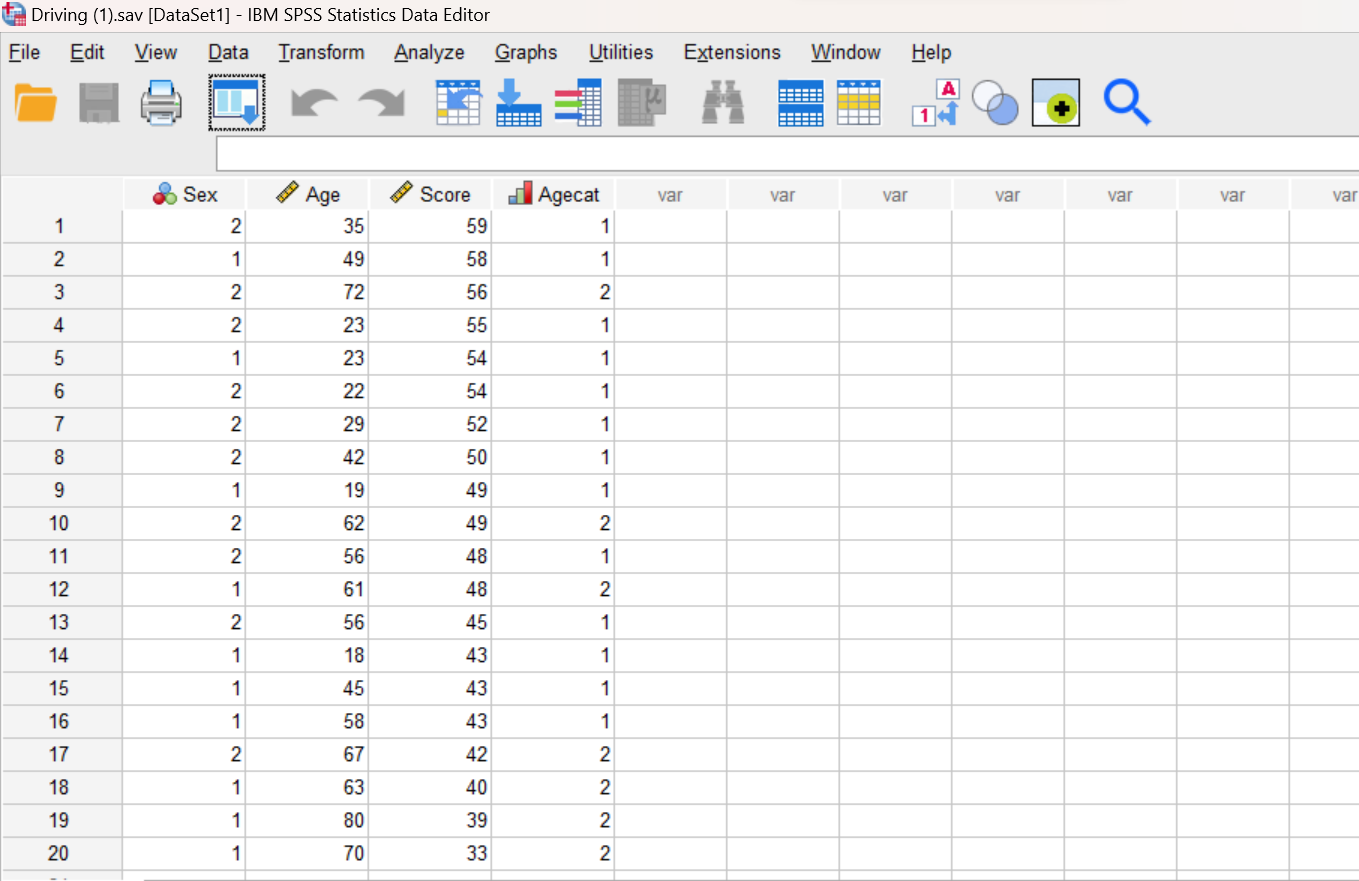
Additional commands are available for computing descriptive statistics such as means and standard deviations. In this lab, we will be working with the “Driving.sav” data file you created in the previous laboratory. Do you remember the location where you saved it? See if you can find it now. If you can’t find your copy of this file, you can download a copy from the SPSS Data Files section of this book or from our course area in D2L Brightspace. Once you have located and/or downloaded this file on your computer, you can continue with the lab.
Start SPSS
Start SPSS using the same procedure as in previous labs. You should be able to find SPSS from your application menu or through your program search tool. At the SPSS welcome window, just press the close button and it should take you to the Data Editor window.
Load a Data File
Use the SPSS File menu to locate and open your “Driving.sav” file (File→Open→Data). Note that you can also download and open an SPSS data file directly from D2L Brightspace by navigating to the file in our course area and then clicking on the file name.
Generate Descriptive Statistics
As you learned in the previous laboratory, the FREQUENCIES command is a good option for examining categorical variables such as Sex and Agecat because it can be used to show how many people are in each category (e.g., the number of males and females). In addition to generating frequency tables and graphs, the FREQUENCIES command has an option for displaying descriptive statistics such as means, medians, and standard deviations, which would be useful for continuous variables. In this laboratory, however, we’re going to learn about two other commands, DESCRIPTIVES and EXAMINE, which are specifically designed to compute descriptive statistics for continuous variables.
The DESCRIPTIVES command gives a basic set of commonly used descriptive statistics.
The EXAMINE command gives a more comprehensive set of descriptive statistics and provides an option for generating plots, including stem-leaf and box plots.
Open a Syntax Editor window (File→New→Syntax) and use the DESCRIPTIVES command to generate descriptive statistics for the Age variable by using the following command code.
DESCRIPTIVES VARIABLES = age
/STATISTICS = ALL.
The STATISTICS subcommand is used to ask for specific statistics; in this case we are asking for all of them! If this subcommand is left off, DESCRIPTIVES gives mean, minimum, maximum, and standard deviation by default.
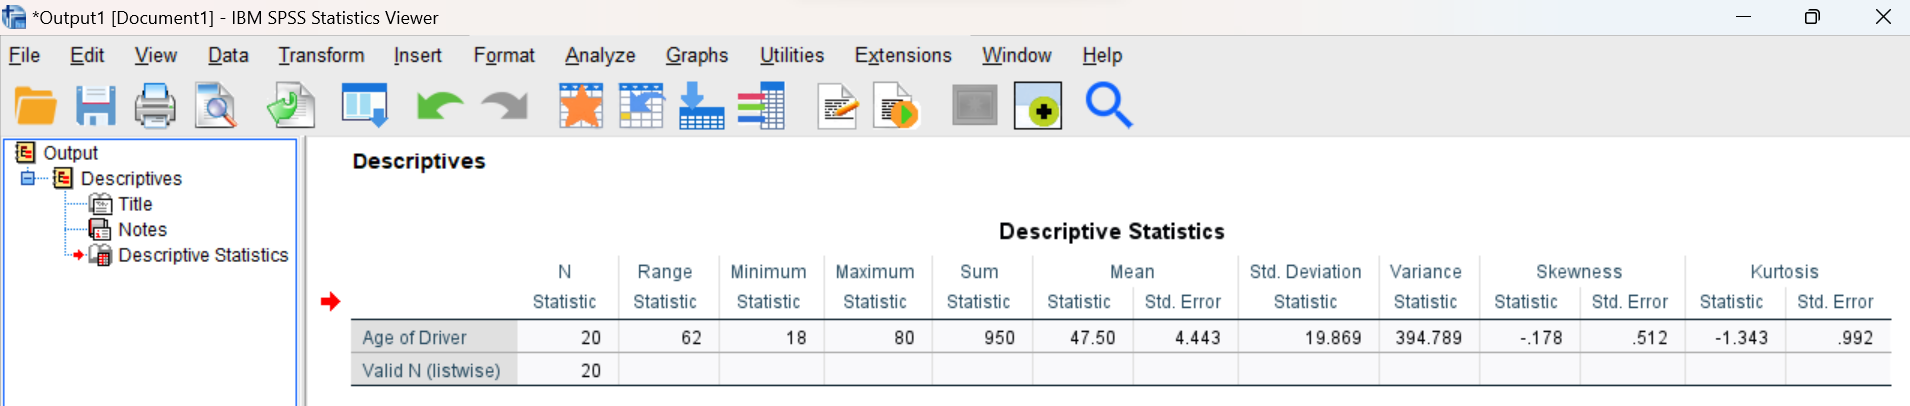
Run the command (remember how we used the green triangle icon to run commands in previous labs) and examine the results of the command in your Statistics Viewer window. It should look something like this:
Annotate Your Descriptives Output
By now you should be comfortable with the procedure for inserting text into your output file. If you’ve forgotten how to do that, refer to the previous lab for detailed instructions. Add a sentence or two after the table to describe the output you just produced for the Age variable. As you write your annotation, be sure to include a mention of the mean, standard deviation, variance, minimum, and maximum age for the drivers in this dataset.
Generate Descriptive Statistics with the EXAMINE Command
Go back to your Syntax Editor window and use the EXAMINE command to generate descriptive statistics for the Age variable by using the following command code.
EXAMINE VARIABLES = age
/PERCENTILES(25,50,75)
/STATISTICS = ALL.
The PERCENTILES subcommand gives the values of variables at particular percentile cutoffs. In this case, we are requesting the first and third quartiles (Q1 and Q3) as well as the median (Q2). Note that the quartiles are the scores that divide the distribution into four equal pieces (25% of the scores in each quartile).
The STATISTICS subcommand is similar to the one for the DESCRIPTIVES command, except that it allows a few more options, including the median, confidence intervals, and interquartile range.
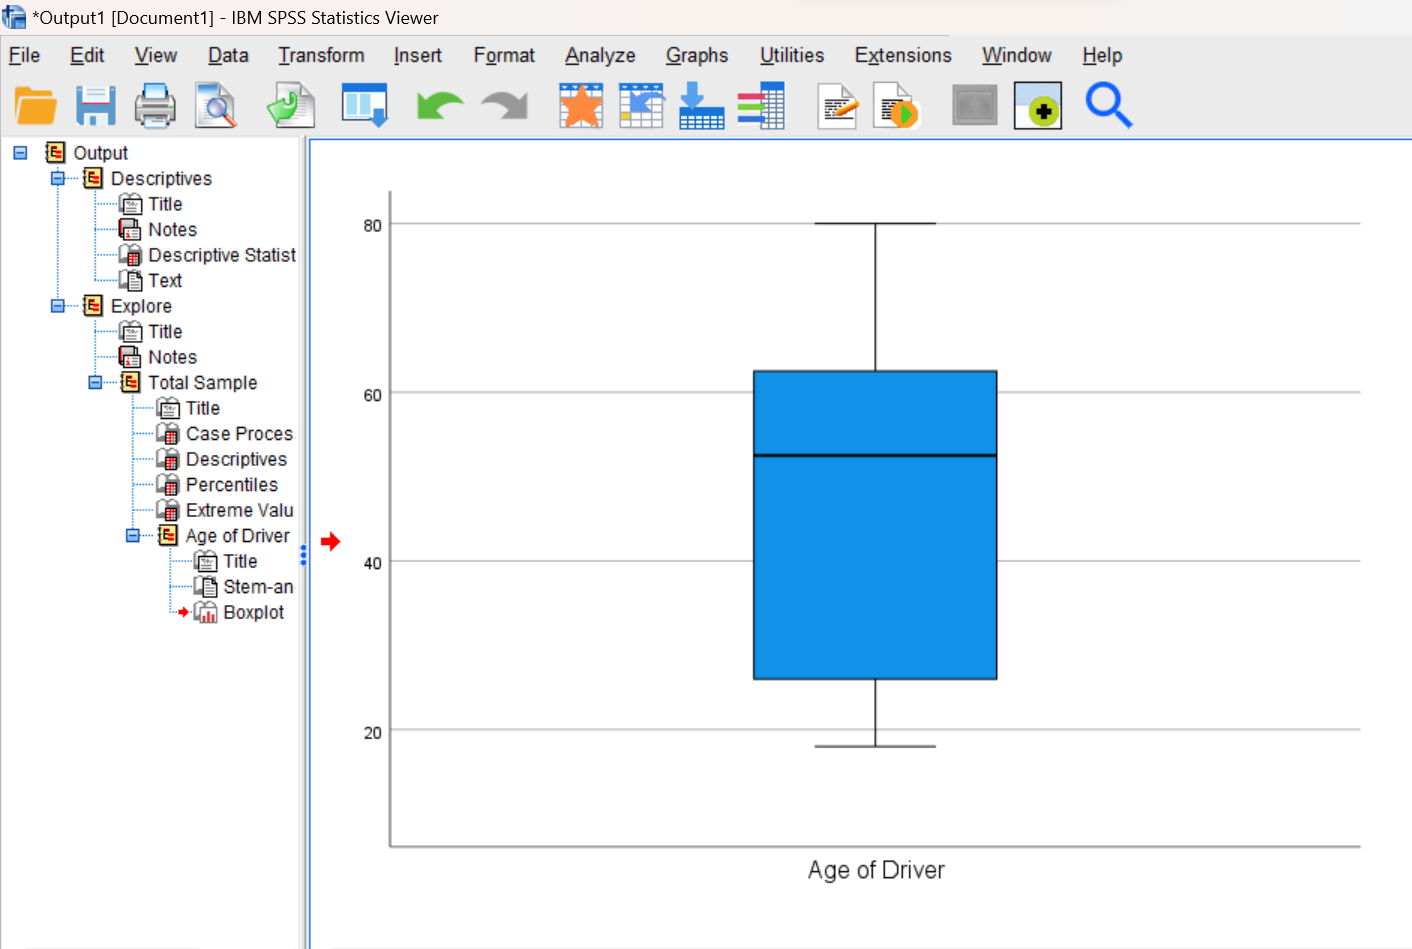
After running this command, review the results in your Statistics Viewer window. Much of the data will match what you already calculated above with the DESCRIPTIVES command but you’ll have a few more stats here, plus a graph. Notice how the box plot (shown in the figure below) highlights the middle 50% of the distribution of scores (from Q1 to Q3) in the box. The horizontal black line running through the middle of the box plot represents the median of the distribution. If you want some additional help interpreting what a box plot shows, see https://www.simplypsychology.org/boxplots.html for a fairly comprehensive discussion.
Annotating Your Examine Output
Again, add a sentence or two at the end of your output file to describe your results for this command. This time, your report should include the median age, the values for the 25th and 75th percentiles (Q1 and Q3, from first row in Percentiles table), and the interquartile range, which is the difference between Q1 and Q3. You can find the interquartile range value in the Descriptives table, but note that it is rounded to an integer value.
Run Descriptive Statistics from SPSS Menus
Now, let’s practice using the menus and dialog boxes to execute these same commands, but this time we will run them for the driving Score variable. Note that both commands can be run from the SPSS Analyze menu. Particularly, we will be using Descriptives and Explore in the Descriptive Statistics menu.
Note on Examine/Explore command: The Explore command in the SPSS menu system is the same as the EXAMINE command that can be run from the Syntax Editor. Also, the EXAMINE command in the Syntax Editor window will be labeled as EXPLORE in the left pane of your output window. I agree, kind of confusing that SPSS using two different names for the same command!
Navigate to the Descriptives dialog box (Analyze→Descriptive Statistics→Descriptives) and move your Score variable to the Variables box as shown here:
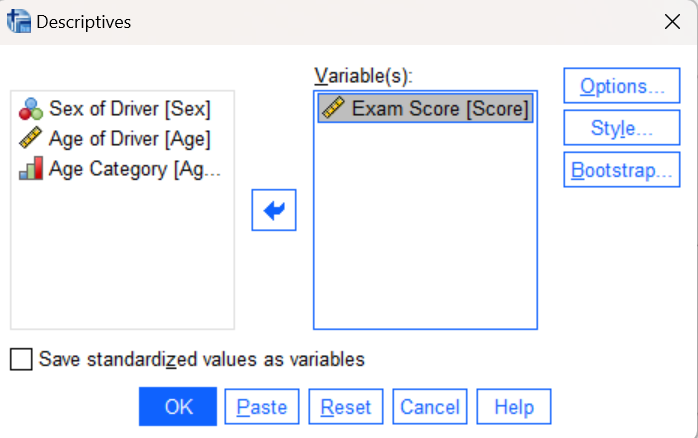
Click on the Options button to see what descriptive statistics are selected. Be sure to check the boxes for mean, standard deviation, minimum, and maximum if they are not already checked. Press the OK button at the bottom of the dialog box to run the command.
Annotate Your Descriptives Output
Add some comments into your output file after this table to describe your results for the driving exam score data. Be sure to report the mean, standard deviation, minimum, and maximum driving exam score. Remember to write your annotations out in complete sentences, not bullet points.
Splitting Data by a Categorical Variable
Now, let’s use the Explore command to further examine the exam score data. One nice feature of the Explore command is that it allows you to split your data based on a categorical variable and display descriptive statistics for each category. To illustrate this feature, we’re going to use Explore to generate a separate set of descriptive statistics for young and old drivers (based on our Agecat categorical variable).
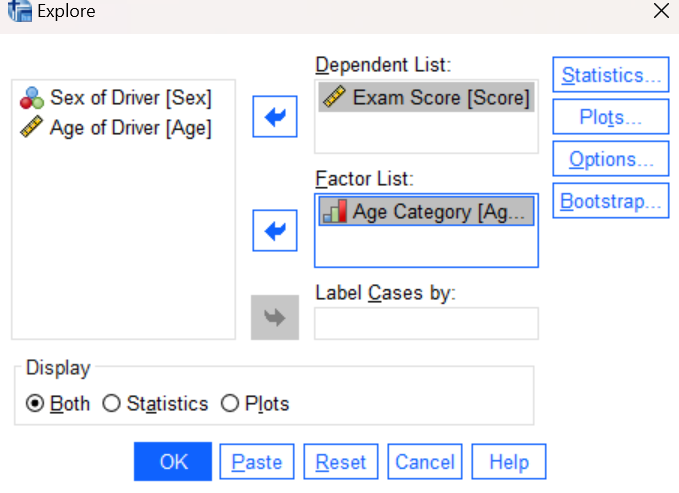
Navigate to the Explore dialog box (Analyze→Descriptive Statistics→Explore), move your Score variable to the Dependent List box and Agecat variable to the Factor List box. “Factor” is SPSS language for a grouping, categorical variable (whether that is an independent variable or a quasi-independent variable):
Click on the Plots button and toggle the checkmark to select histogram and not stem-and-leaf plot. Press the OK button at the bottom of the dialog box to run this command. Then examine the output in your Statistics Viewer window. You should see a breakdown of descriptive statistics by young vs. old drivers.
Annotate Your Explore Output
Add a couple of sentences at the bottom of your output file interpreting your results. This time, try to follow the instructions on APA formatting in the Reporting Descriptive Statistics (Annotations) in APA Style chapter. Which group of drivers performed better on the exam, the older ones or the younger ones? In addition to answering this question, please include the following items in your annotation statements:
- The number of drivers in each group
- The mean exam score and standard deviation for each group
- Where the scores were most concentrated for each group (based on what you see in the boxplots)
Insert Your Name
One other annotation you should always add to your assignments is your name. If you have not already done so, insert your name and Lab #3 at the very top of your statistical output as an identifier. See the previous lab instructions or ask a lab assistant if you need instructions for how to do this.
Clean up Your Statistical Output
Take a few minutes now to examine and clean up the contents of your Statistics Viewer window. When you’re done it should include only the following items as well as your annotations:
- Descriptives command output for the Age variable
- Examine (labeled as Explore in left outline in the output) command output for the Age variable
- Descriptives command output for the Score variable
- Explore command output showing descriptive statistics for the Score variable broken down by age category (Agecat)
Save Your Work and Exit SPSS
Upon completing the exercises in this laboratory, please save the contents of your Syntax Editor and Statistics Viewer windows to files on your own personal drive or workspace on the network. Give them meaningful names (e.g., Lab 3) so that they can be identified with this week’s lab. Use the Print to PDF (Windows computer) or Export (Mac computer) function with “visible output” option to save a PDF version of your output file as you did in the previous labs.
Note that the driver’s exam dataset need not be saved because you already have a copy and have not made any changes to it in this lab.
You can now exit SPSS by selecting the Exit option from the File menu in the active SPSS window.
Submit Your Lab
Remember to submit the PDF version of your completely annotated output file in the D2L Brightspace Assignments folder when you are done. After uploading the file to D2L, open it from the assignments folder and check to make sure you have submitted the correct file.